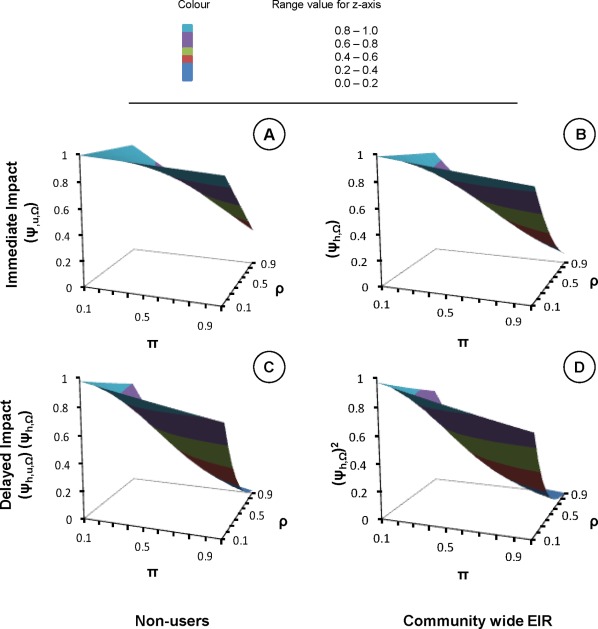
Figure 2. Immediate and delayed impact of personal protection upon malaria transmission intensity.
In all the four panels, x-axis is the proportion of human exposure to mosquito bites that would otherwise occur when the protective intervention is used  and y-axis represents the proportion of mosquito bites prevented by using that protective intervention
  . The z-axes reflects immediate (A and B) and delayed (C and D) relative exposure
  experienced by non-users (A and C) and average community members (B and D).

