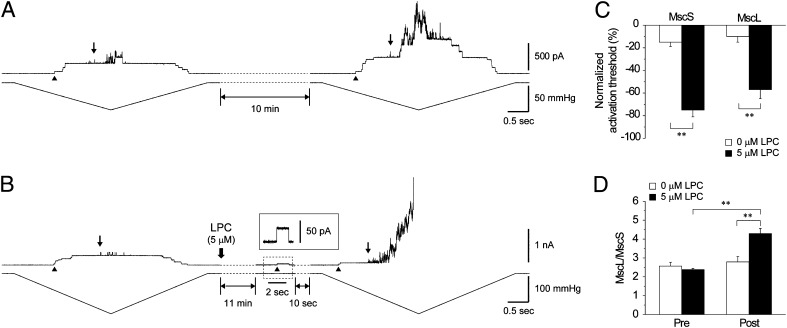
Fig. 4.
LPC effect on MscS and MscL. (A) MscS and MscL activation thresholds were recorded by applying pressure ramps for 10 min after training the patch. After another 10 min, the pressure ramp was reapplied. First MscS (arrowhead) and MscL (arrow) opening are indicated. (B) LPC (5 µM) was applied to the bath after the 10-min interval. Inset shows a single channel trace of MscS at +30-mV pipette voltage. (C) Normalized activation threshold of MscS and MscL coreconstituted into azolectin (100%) liposomes before and after 10-min interval in the absence and presence of 5 µM LPC (mean ± SEM; n = 5). (D) TR before and after addition of 0 and 5 µM LPC (mean ± SEM; n = 5). Significant differences are indicated by asterisks in C and D (**P < 0.01 by t test).

