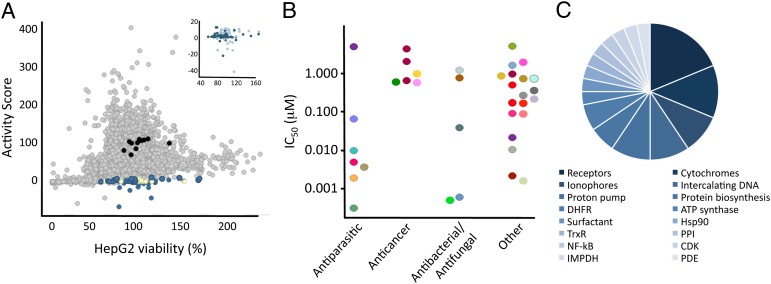
Fig. 1.
Analysis of screening results. (A) Negative controls (black), positive controls (yellow), 5,375 small molecules (gray), and screening actives (blue) are plotted as a function of their effect on HepG2 viability and inhibition of liver-stage malaria (activity score). Inset shows screening hits (dark blue) and actives that were eliminated as candidates with secondary assays (light blue). (B) Hits were grouped by function and plotted vs. their determined liver-stage Plasmodium IC50. Different compound classes of screening hits (31 total) are represented by different colors. (C) Distribution of hit function or human targets of screening hits.

