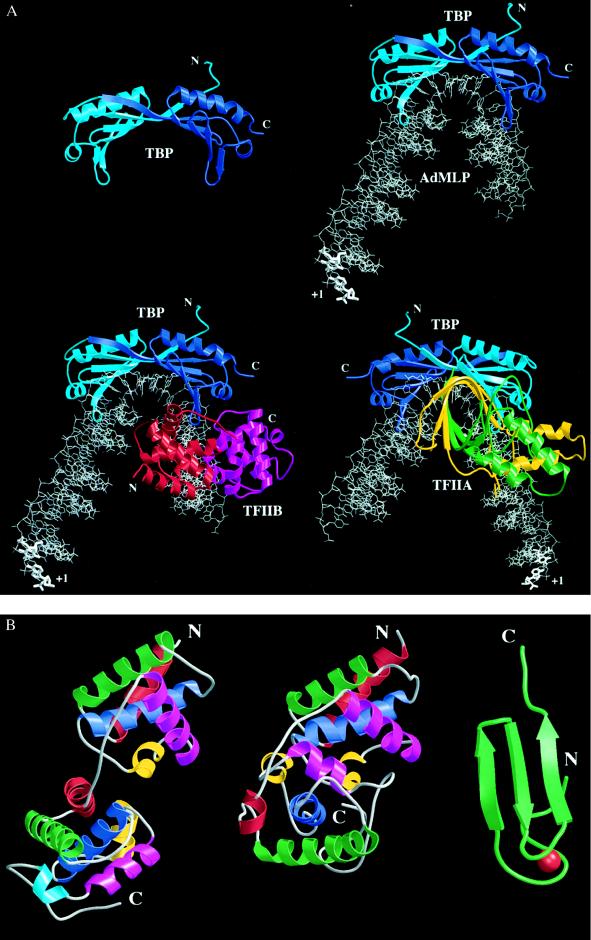
Figure 2.
(A) Three-dimensional structures of TBP (14–16) (Upper Left), TBP complexed with the TATA element (17–19) (Upper Right), C terminal or core TFIIB (cTFIIB)–TBP–TATA element ternary complex (20) (Lower Left), and TFIIA–TBP–TATA element ternary complex (21, 22) (Lower Right). The proteins are depicted as ribbon drawings, with their N and C termini labeled when visible. The DNA is shown as a stick figure, with hypothetical, linear, B-form extensions at both ends. The transcription start site of the AdMLP is labeled with +1. TBP, and the TBP–DNA and cTFIIB–TBP–DNA complexes are shown from the same vantage point downstream of the transcription start site. The TFIIA–TBP–DNA complex is viewed from upstream of the TATA element, looking toward the transcription start site. Molecules are color coded as follows: red, cTFIIB first repeat; magenta, cTFIIB second repeat; light blue, TBP N terminus and first repeat; dark blue, TBP second repeat; green, TFIIA small subunit; yellow, TFIIA large subunit; and gray, DNA. When TBP recognizes the minor groove of the TATA element, the DNA is kinked and unwound to present the minor groove edges of the bases to the underside of the molecular saddle. On cTFIIB or TFIIA binding to the TBP-DNA complex there is essentially no change in the structure of the binary complex. (B) Structural details of TFIIB. The relative orientation of the cTFIIB’s two domains in the free and bound form is completely different. The bound and free cTFIIBs are drawn with their first domains aligned. The N and C termini of the protein fragments used in the structural studies are labeled, and the α-helices of each cTFIIB domain are colored in order red, green, blue, yellow, and magenta. A helix present only in the second domain of cTFIIB in the ternary complex is colored light blue. Structure of cTFIIB in the cTFIIB–TBP–TATA element ternary complex (20) (Left). Structure of free cTFIIB (23) (Center). Structure of the N-terminal, Zn2+ binding region of TFIIB (24) (Right). The Zn atom is colored in red. The 60 residues between the C terminus of the Zn2+ binding domain and the N terminus of cTFIIB are flexible and have not been visualized in high-resolution structural studies.

