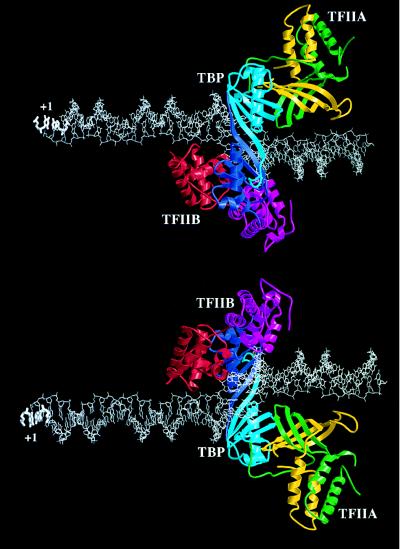
Figure 3.
Model of the TFIIA–TFIIB–TBP–DNA complex based on the structures of the cTFIIB–TBP–TATA element (20), and the TFIIA–TBP–TATA element (21, 22) complexes (see Fig. 2A). The transcription start site is labeled with +1. The color coding scheme is the same as in Fig. 2A. (Upper) Viewed along TBP’s axis of approximate intramolecular symmetry from above the saddle. (Lower) Viewed from below the molecular saddle.

