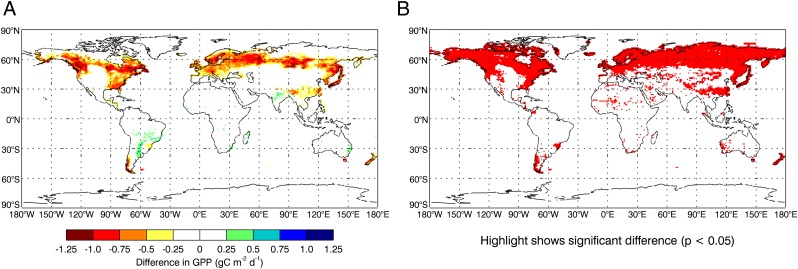
Fig. 3.
Influence of a photoperiod correction of Vcmax on global distribution of GPP. (A) Difference in GPP (simulation with photoperiod correction minus simulation without) averaged over September, October, and November for the simulation period 1988–2004. (B) Red area indicates P value < 0.05 for two-tailed t test of significance for differences shown in A, where sample is based on 17 individual years.

