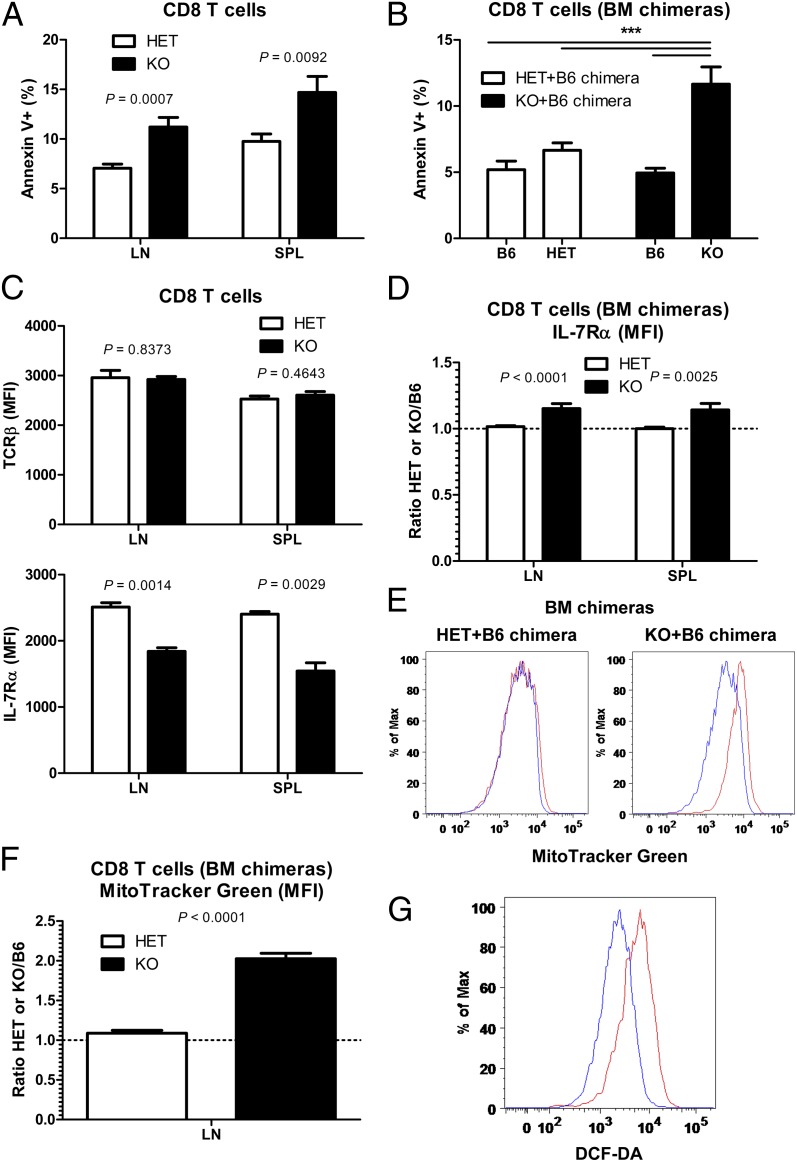
Fig. 4.
Vps34 promotes CD8 T-cell survival by ensuring mitochondrial homeostasis. (A) Frequency of apoptotic (Annexin V+) cells among total CD8 T cells from LN and spleen (SPL) of Vps34 HET and KO mice (n = 7–9). (B) Frequency of apoptotic (Annexin V+) cells among total B6 WT, Vps34 HET, and Vps34 KO LN CD8 T cells from Vps34 HET/B6 and Vps34 KO/B6 mixed BM chimeras (n = 16–17). P < 0.0001 (one-way ANOVA). P values determined by Tukey’s multiple comparison test are indicated by asterisks (***P < 0.001). (C) Cell surface expression of TCRβ and IL-7Rα by naïve (CD44lo) CD8 T cells from Vps34 HET and KO mice was determined using FACS (n = 3). MFI, mean fluorescence intensity. (D) Cell surface expression of IL-7Rα by LN and spleen (SPL) naïve (CD44lo) CD8 T cells from Vps34 HET/B6 and Vps34 KO/B6 mixed BM chimeras (n = 15–17). IL-7Rα expression (MFI) by Vps34 HET and KO CD8 T was normalized to expression by WT B6 cells in the same individual chimera (i.e., ratio of Vps34 Het or KO to WT B6). A ratio of 1.0 represents equal IL-7Rα expression by Vps34 HET or KO cells compared with WT B6 cells. (E) Representative FACS analysis of MitoTracker Green staining in LN CD8 T cells from Vps34 HET/B6 and Vps34 KO/B6 mixed BM chimeras. Blue and red histograms represent B6 and HET or KO cells, respectively. (F) Quantification of MitoTracker Green staining in LN CD8 T cells from Vps34 HET/B6 and Vps34 KO/B6 mixed BM chimeras (n = 16–17). Staining was normalized to WT B6 cells as described in D. (G) Representative FACS analysis of DCF-DA staining in LN CD8 T cells from Vps34 HET and KO mice. Blue and red histograms represent HET and KO cells, respectively. Data are from one experiment (C) or cumulative from two (A and G) or three (B and D–F) independent experiments.

