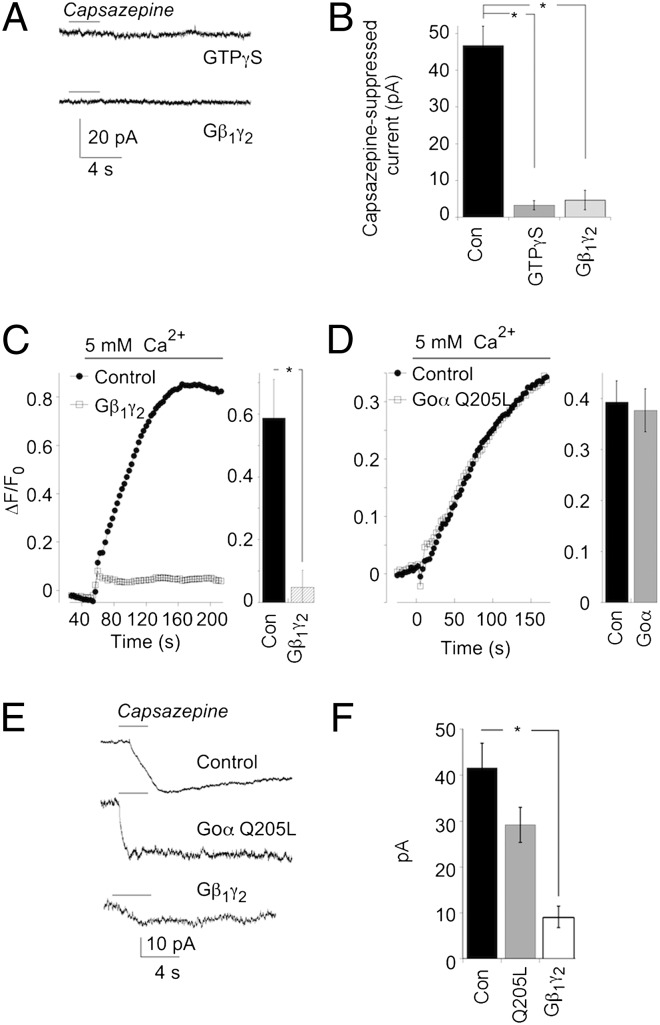
Fig. 3.
Application of exogenous Gβ1γ2 closes TRPM1 channels. (A) Representative responses to capsazepine in an HEK-TRPM1 cell dialyzed with 100 μM GTPγS (Upper), and an HEM dialyzed with 100 nM Gβ1γ2 (Lower). (B) Summary of experiments in A. Control data are pooled from both HEK-TRPM1 and HEMs (n = 24 cells). Experiments with dialysis of GTPγS (n = 7) were carried out on HEK-TRPM1 cells. Dialysis of Gβ1γ2 (n = 3) was carried out on HEMs. *P < 0.0001. (C, Left) example of a Ca2+ imaging experiment performed on control (filled symbols) and Gβ1γ2-transfected (open symbols) HEK-TRPM1 cells. (Right) Summary of the maximum ΔF/F0 for each group (control, n = 6 coverslips; Gβ1γ2, n = 9 coverslips; *P = 0.005. (D) As in C, except that cells were transfected with Gαo Q205L. (Right) Summary of the maximum ΔF/F0 for each group (control, n = 7 coverslips; Gαo Q205L-transfected cells, n = 9 coverslips). (E) Representative responses to capsazepine from an HEK-TRPM1 cell transfected with GFP alone (Top), Gαo Q205L and GFP (Middle), and Gβ1γ2 and GFP (Bottom). (F) Mean ± SEM of responses to capsazepine recorded in each condition (GFP only, n = 18; Gαo Q205L-transfected cells, n = 8; Gβ1γ2-transfected cells, n = 12). The difference between control and Gβ1γ2 (P < 0.0001), but not Gαo Q205L (P = 0.13), was highly significant.

