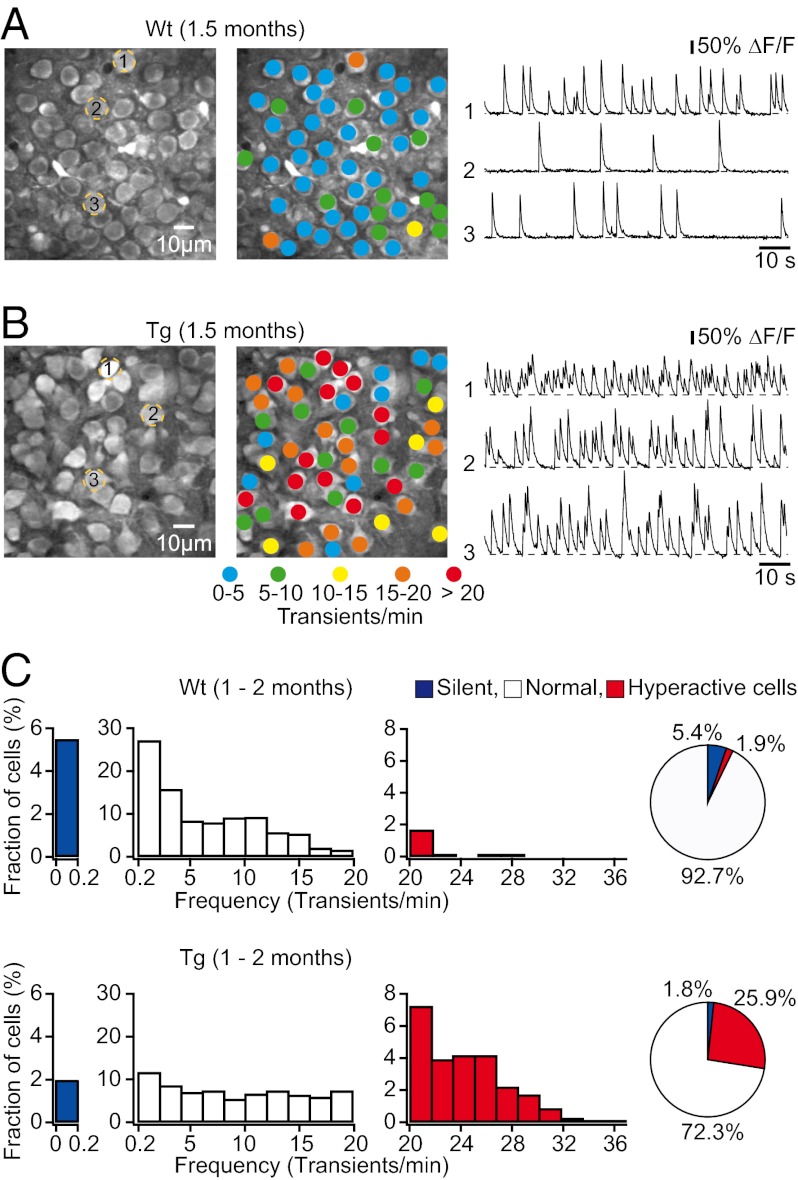
Fig. 2.
Abnormal hyperactivity of hippocampal neurons in predepositing transgenic mice. (A and B) (Left) CA1 neurons imaged in vivo in a wild-type and a transgenic mouse, respectively. (Center) Activity maps, in which hue is determined by the frequency of spontaneous Ca2+ transients, overlaid with the anatomical image (Left). (Right) Spontaneous Ca2+ transients of the corresponding neurons marked (Left). (C) The frequency distribution of spontaneous Ca2+ transients was shifted toward higher frequencies in tg (Lower; n = 818 cells in seven mice) compared with wild-type mice (Upper; n = 693 cells in six mice). Pie charts show the relative proportions of silent, normal, and hyperactive neurons.

