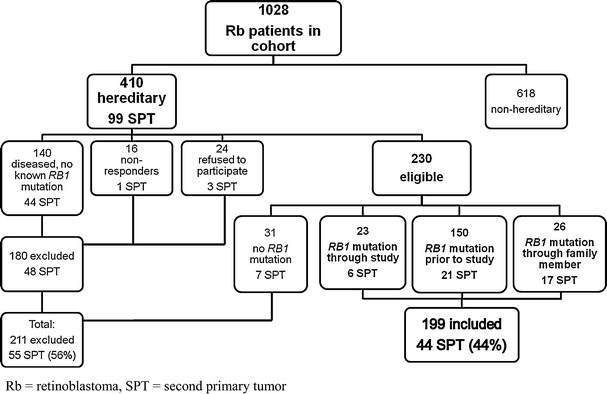
Fig. 1.

Flow chart showing reasons for inclusion and exclusion of retinoblastoma patients with hereditary retinoblastoma from our cohort. In the total group of 410 hereditary retinoblastoma patients from our cohort, 99 primary tumors (SPT) have been diagnosed. In the flow chart is also depicted in which in- or excluded group these SPT’s have occurred. Percentage is calculated from the total of 99 SPT’s
