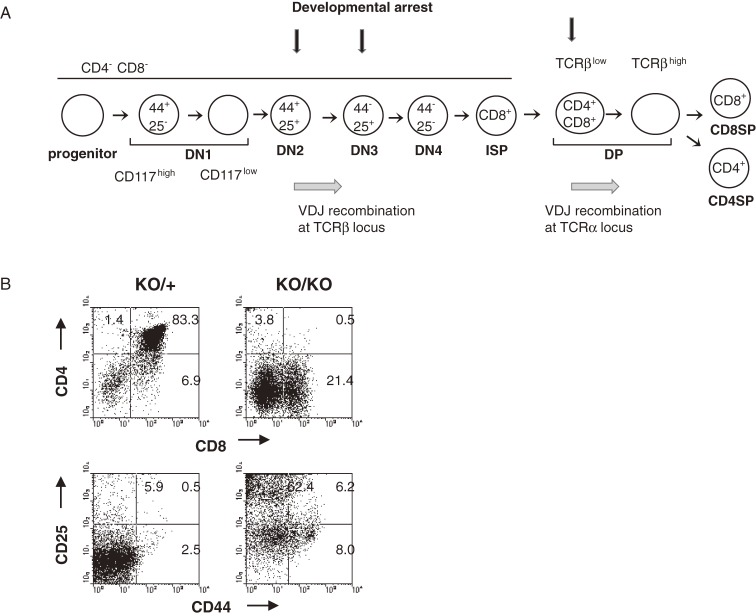
Figure 2.
(A) The diagram illustrates stages of T-cell development in thymus. Differentiation markers used here are CD117, CD44, CD25, CD4, CD8, and TCRβ on cell surface. See the text for details of development of αβ T cells. In brief, it proceeds in order of maturity, CD4−CD8− double negative (DN), CD4+CD8+ double positive (DP), and CD4+CD8− or CD4−CD8+ single positive cells (CD4SP or CD8SP cells, respectively). Vertical arrows indicate stages of developmental arrest given by loss of Bcl11b. (B) Flowcytometry of thymocytes in Bcl11bKO/+ and Bcl11bKO/KO mice using CD4, CD8, CD44, and CD25 markers. The vertical axis shows CD4 expression and the horizontal axis displays CD8 expression in total thymocytes (upper); the vertical axis shows CD25 expression and the horizontal axis displays CD44 expression in the CD4/CD8 double-negative quadrant (lower).

