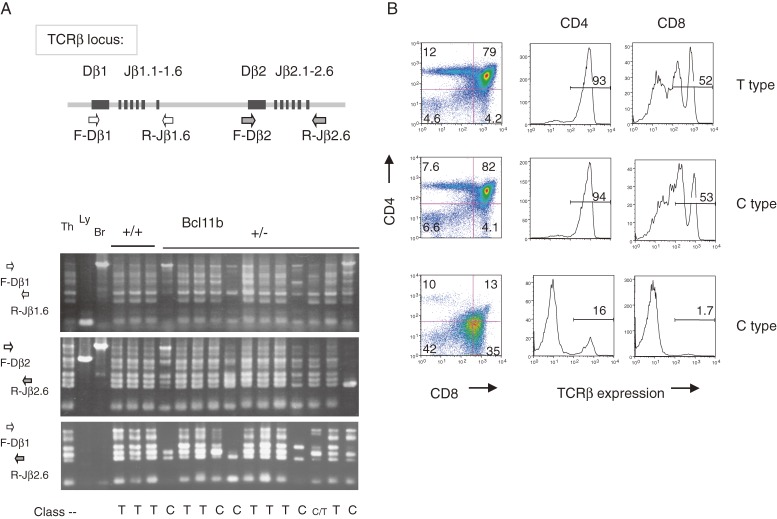
Figure 4.
Clonal proliferation of thymocytes in atrophic thymuses after γ-irradiation of Bcl11bKO/+ mice. (A) The upper diagram shows part of the TCRβ locus and the relative location of PCR primers. The lower panel shows gel electrophoresis of PCR products with three different sets of primers, F-Dβ1 and R-Jβ1.6 (top), F-Dβ2 and R-Jβ2.6 (middle), and F-Dβ1 and R-Jβ2.6 (bottom). Thymuses are classified into two group, T type thymus (similar to normal thymus) and C type thymus (showing clonal expansion) depending on band patterns of PCR products. The T type thymus shows all six different bands as normal thymus does, whereas the C type thymus shows skewed band patterns, a few bands being more prominent than the other bands. The latter pattern indicates the presence of clonally proliferating thymocytes. (B) Flowcytometry of CD4, CD8 and TCRβ expression on thymocytes, showing differences in differentiation level. The vertical axis shows CD4 expression and the horizontal axis displays CD8 expression (left); the vertical axis shows cell number and the horizontal axis displays TCRβ expression of thymocytes in the CD4 quadrant (middle) and in the CD8 quadrant (right). Some C type thymuses showed differentiation arrest and lower expression of TCRβ on surface.

