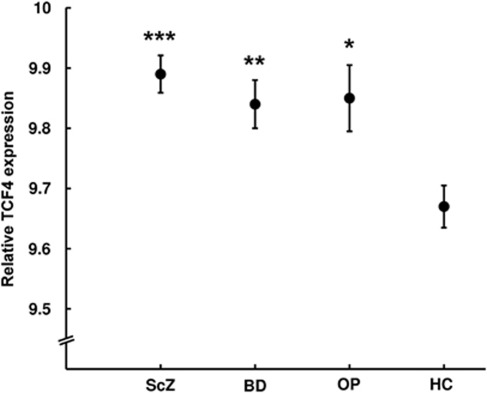
Figure 1.
Relative TCF4 mRNA expression between the diagnostic groups. The figure shows significantly lower TCF4 mRNA expression in healthy controls (HC, n=212) compared with ***schizophrenia (ScZ, n=232, P=8.6 × 10⁻⁵), **bipolar disorder (BD, n=200, P=0.005) and *other psychoses (OP, n=73, P=0.049). Mean values with ± one standard error are presented.

