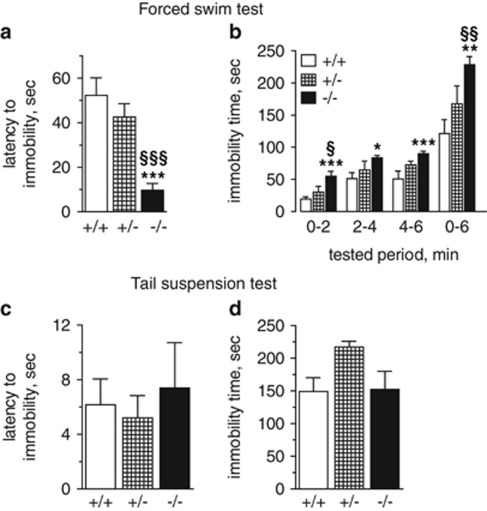
Figure 3.
Depression-like behavior in Tph2−/− mice. Forced swim test: (a) Latency to the first immobility episode. (b) Immobility time during 2 min intervals and the whole 6 min of tested period. Tail suspension test: (c) Latency to the first immobility episode. (d) Immobility time during 6 min of tested period. Data are shown as means±s.e.m., (a, b): n=10, (c, d): n=9. ***P<0.001, **P<0.01, *P<0.05 vs Tph2+/+; §§§P<0.001, §§P<0.01, §P<0.05 vs Tph2+/−, one-way ANOVA with Bonferroni correction. ANOVA, analysis of variance.

