Figure 4.
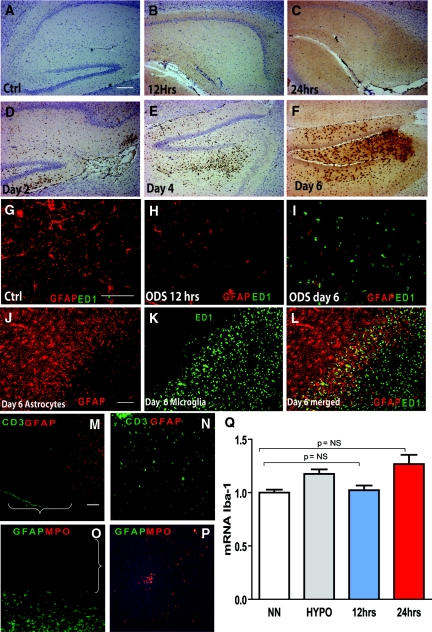
Loss of astrocytes is independent of microglial activation and lymphocytes/neutrophils infiltration. No activated microglial cells (anti-CD68, clone ED1) were present in controls (A) or in rats at 12 hours (B) or 24 hours (C) postcorrection. Microglial cells were detected at 2 (D), 4 (E), and 6 days after the correction (F). The scale bar is 100 μm. Double immunofluorescence for activated microglia (CD68, clone ED1 in green) and astrocytes (GFAP in red) in uncorrected controls (G) confirmed the homogenous distribution of astrocytes and the absence of microglia. Astrocytes were scarce 12 hours postcorrection, and no microglial cells were detected (H). (I) Massive microglial activation and complete astrocyte loss were found 6 days postcorrection. At that time, numerous hypertrophic astrocytes were seen at the lesion border (J), and activated microglial cells were only present at the center and within the borders of the lesions (K through L). The scale bar is 100 μm. In (M through P), double immunofluorescence for astrocytes (GFAP in red) and lymphocytes (CD3 in green) in the brain (M) with spleen tissue as a positive control (N) and in (O), double immunofluorescence for neutrophils (myeloperoxidase (MPO) in red) and astrocytes (GFAP in green) with thymus tissue as a positive control (P) demonstrates that no MPO- or CD3-positive cells could be detected either within or around the regions of astrocyte loss (brackets). The scale bar is 100 μm. The graph in (Q) shows that no significant differences in the gene expression of Iba1 mRNA, a marker of microglial activation, in normonatremic controls (NN) or hyponatremic rats (HYPO) and 12 and 24 hours after correction (n = 5 to 7, P = NS by ANOVA). Ctrl, control; GFAP, glial fibrillary acidic protein; ODS, osmotic demyelination syndrome; ED1, ectodermal dysplasia 1.

