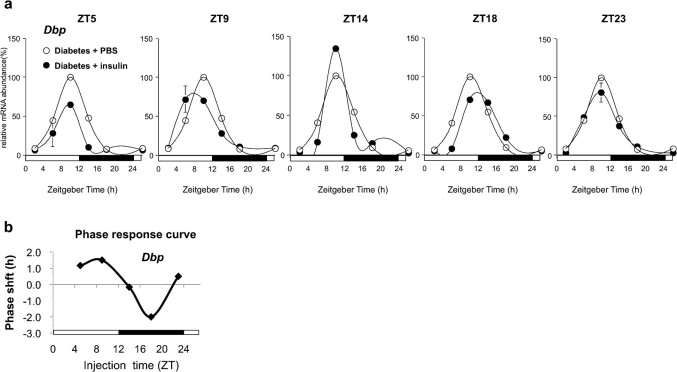
Figure 6. A single administration of insulin induces phase-dependent bi-directional phase shifts in diabetic rat livers.
(a) Temporal Dbp mRNA expression levels were determined by northern blot analysis of the livers from control or STZ-induced rats harvested over a 24-h period. Rats were maintained under light-dark conditions and injected intraperitoneally at the indicated times with insulin (50 U·mg−1·kg−1) dissolved in PBS or in PBS alone. Values represent mean ± SEM of 2–3 PBS- (open circles) or insulin-administered (filled circles) rats. (b) The phase response curve of circadian liver gene expression was obtained by recording the circadian Dbp mRNA after injecting insulin into STZ-induced rats at the indicated times.

