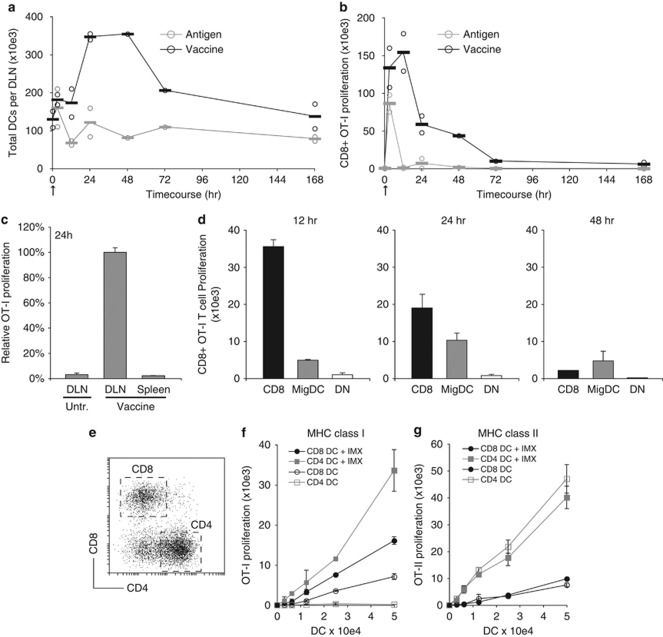
Figure 6.
ISCOMATRIX adjuvant facilitates antigen entry into the MHC class I cross-presentation pathway in DCs. (a) Time-course showing the number of CD11c+ DCs isolated from the DLN of mice injected with vaccine or OVA (antigen) alone. (b) MHC class I cross-presentation was quantified in the DLN ex vivo after a single dose of ISCOMATRIX vaccine or OVA (antigen) alone. The CD11c+ DC fraction (>90%) was purified from the DLN at the indicated times. A total of 5 × 10³ DCs were then co-cultured with 5 × 10⁴ CFSE-labeled OT-1 CD8+ T cells. Proliferation was quantified 60 h later by flow cytometry. Circles in (a) and (b) represent data points from independent experiments (an average of n=4–8 DLN per sample), and bars show the pooled average. (c) MHC-I presentation by CD11c+ DCs purified from the spleen or DLN 24 h after a single ISCOMATRIX vaccine dose. OT-I proliferation was determined as in (b). (d) Highly purified (>95%) populations of CD8, DN and MigDC were purified from the DLN 12, 24 and 48 h after a single vaccine dose. Cross-presentation was assessed by co-culturing each DC population with 5 × 10⁴ CFSE-labeled OT-1 cells and quantifying proliferation 60 h later. (e) CD11c-enriched spleen DCs were separated into CD8 and CD4 populations by flow cytometry (>95% purity). (f) CFSE-labeled OT-I T cells were co-cultured with CD8 or CD4 DCs pulsed for 30 min with OVA (antigen) alone (open symbols) or antigen+ISCOMATRIX (closed circles). Pulsed DCs were cultured with CFSE-labeled OT-I cells, and proliferation was determined after 60 h as described. (g) The same DCs used in (f) were co-cultured with CFSE-labeled CD4+ OT-II T cells. Proliferation was quantified as described. Error bars represent the s.d. of triplicate samples. Results are representative of two or more independent experiments.

