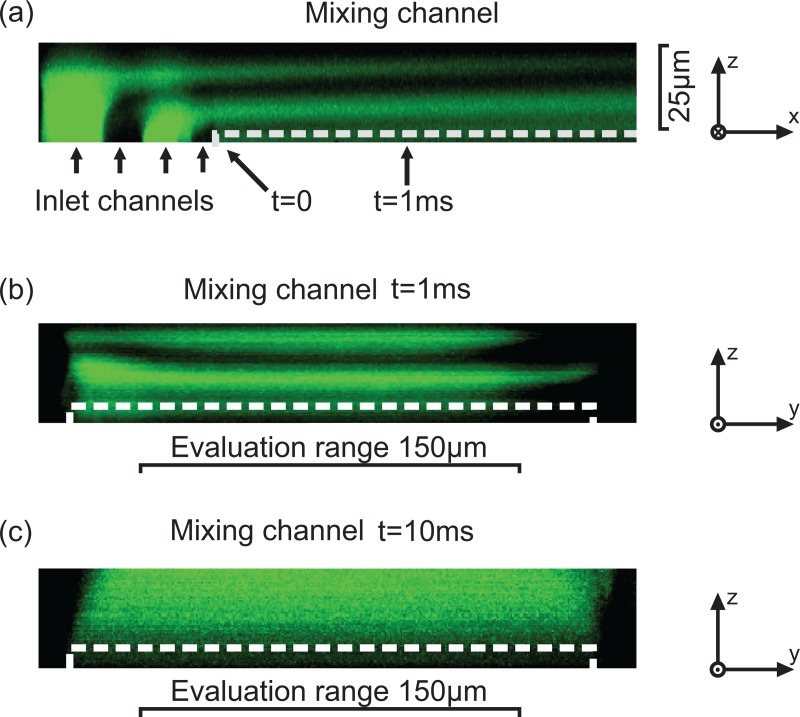
Figure 3.
Measurement result of a confocal measurement with (a) a length view of the mixing channel and a cross sectional view of the mixing channel at a time of (b) 1 ms and (c) 10 ms. The white dashed line shows the channel bottom. The edges do not mix well and are therefore left out of the measurement. Because of the excellent mixing performance of the micromixer an evaluation range (width) of no less than 150 μm can be applied.

