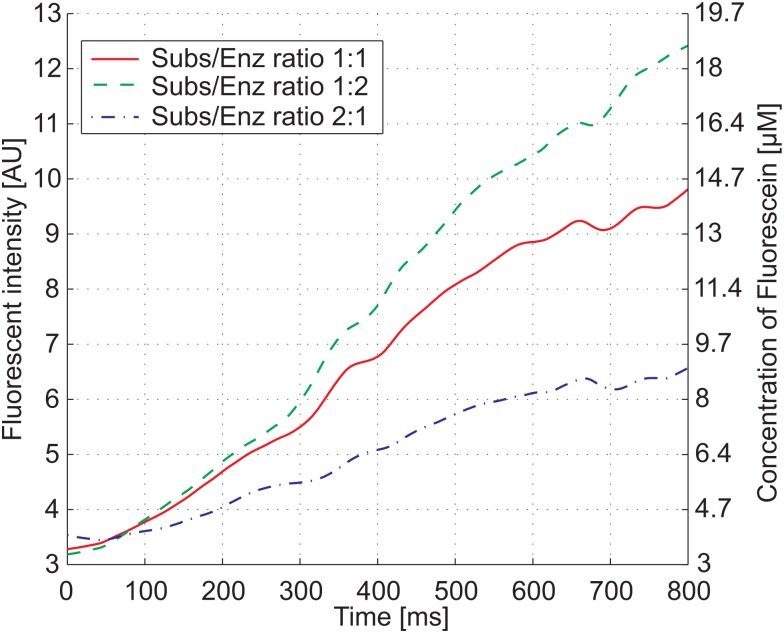
Figure 6.
Fluorescent signal of the pre-steady state kinetics of FDG after it is hydrolyzed by β-galactosidase. In the measurement, the ratio between substrate and enzyme was varied resulting in different concentrations (see Table TABLE I.). The left y-axis shows the measured fluorescent intensity, while the right y-axis shows the amount of fluorescein present in the channel.

