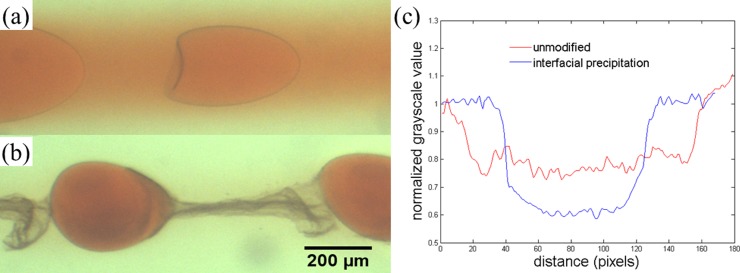
Figure 6.
Interfacial precipitation for enhancing the encapsulation efficiency of allura red viewed as an optical microscope image of a system of 16 wt. % dextran in the continuous phase and 17 wt. % PEG 8000 in the dispersed phase (a) with no encapsulation and (b) with encapsulation using 2 wt. % CaCl2 in the dispersed phase and 2 wt. % Na2CO3 in the continuous phase (flow rates: 5000 μl/h for continuous phase and 100 μl/h for dispersed phase). (c) Profile of normalized grayscale value across a droplet with and without interfacial precipitation imaged at 2 cm from the nozzle. The normalized grayscale value is obtained by converting the color images into grayscale images and subsequently measuring the grayscale value, which indicates the color intensity in the original color images. The resultant values are normalized by the average grayscale value obtained in the continuous phase. A smaller grayscale value indicates a higher intensity in the original color image. The higher difference in the normalized grayscale value between the droplet phase and the continuous phase for the system with interfacial precipitation indicates an enhanced encapsulation efficiency.

