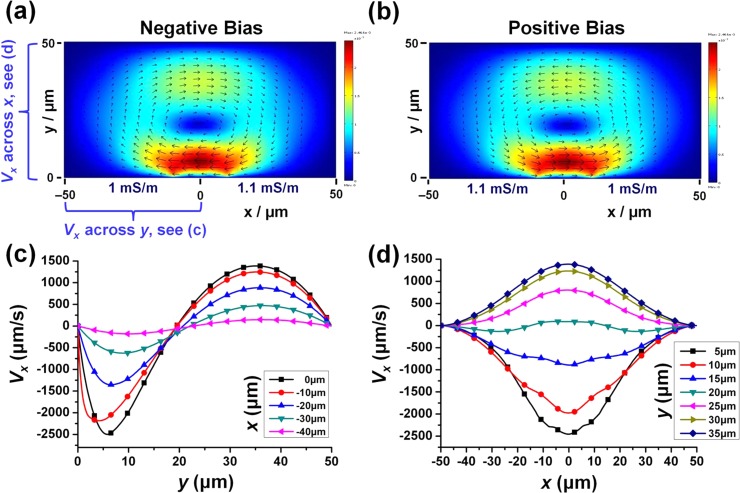
Figure 2.
Simulated velocity distributions. (a) Negative DC-bias, < and (b) positive DC-bias, > . Conditions: voltage amplitude = 10 V, conductivity difference = 10%, W = 100 μm, D = 50 μm, electrode width = 40 μm, and electrode gap = 20 μm. For negative DC-bias of (a), plots of X-velocity (horizontal) across (c) channel depth at various locations along the left electrode, and (d) channel width at different channel heights.

