Abstract
Using a magneto-mechanical solid-fluid numerical model for permanently magnetic artificial cilia, we show that the metachronal motion of symmetrically beating cilia establishes a net pressure gradient in the direction of the metachronal wave, which creates a unidirectional flow. The flow generated is characterised as a function of the cilia spacing, the length of the metachronal wave, and a dimensionless parameter that characterises the relative importance of the viscous forces over the elastic forces in the cilia.
INTRODUCTION
In lab-on-a-chip devices, working fluids have to be pumped between micro-reaction chambers through micron-sized channels. At these small length scales, the viscous forces dominate over the inertial forces. Under this condition, a mechanical actuator has to move in a non-reciprocal manner to cause a net fluid transport.21 In nature, micron-scale fluid manipulation is often performed using periodically beating hair-like structures called cilia. An example of natural fluid manipulation systems is the expulsion of mucus from the lungs caused by the beating of the cilia attached to the inner layer of mammalian trachea. The ciliary beat consists of distinct effective and recovery strokes, which leads to a non-reciprocal motion (a reciprocal motion of actuator is one in which the forward motion is the same as backward motion). In addition to the non-reciprocal motion of individual cilia, adjacent cilia beat with a constant phase difference leading to a coordinated wave-like motion, which is referred to as metachronal motion. Another example of fluid manipulation is the swimming of Cyanobacteria. Points on the surface of Cyanobacteria oscillate symmetrically and generate waves of lateral displacement along their surface. This wave-like motion causes fluid transport in one direction and the bacteria swim in the opposite direction.7
Many examples have appeared in the recent literature of artificial cilia that mimic the natural ciliary motion using different physical actuation forces, imposed by electric fields, magnetic fields or through base excitation.6, 8, 9, 10, 16, 18, 20, 22, 26 In most of the cases the actuation field is uniform,9, 16, 18, 28 so that all artificial cilia beat in-phase, thus only focusing on the non-reciprocal motion of individual cilia. The flow generated by synchronously beating cilia has been analysed in terms of the dimensionless parameters that govern the cilia behaviour.1, 2, 10, 11, 16 The formation of the metachronal waves has been investigated using computational models, which suggest that the coordinated motion is due to the hydrodynamic interaction between adjacent cilia, and that the energy spent per cilium decreases in the presence of metachronal waves.12, 13, 18, 27 Recently, it has been shown that the flow generated by magnetically driven non-reciprocally beating artificial cilia is substantially enhanced and becomes unidirectional when the cilia beat out-of-phase compared to synchronously beating cilia.10, 17 By modelling cilia that beat out-of-phase and possess only orientational asymmetry15 as a porous sublayer, it has been shown that flow can be created in the direction of the metachronal wave.14 However, from a manufacturing and implementation point-of-view, it is not straightforward to generate non-reciprocal motion of the individual cilia. Therefore, it is of interest to investigate whether cilia can create a flow in the absence of any asymmetry but in the sole presence of waves of lateral displacement, similar to that of Cyanobacteria. This is the subject of the present article.
We study an array of permanently magnetic artificial cilia subjected to a non-uniform magnetic field that travels in space and time, such that the cilia beat symmetrically but out-of-phase. The ciliary motion generates a unidirectional fluid flow in a direction opposite to the metachronal wave. The fundamental mechanism which is responsible for the flow is investigated, and the flow is quantified as a function of the parameters of the metachronal wave, cilia spacing, and a physical dimensionless parameter that quantifies the relative importance of the viscous forces compared to the elastic forces. We find that the flow reaches a maximum for critical values of the wavelength of the metachronal wave, which depends on the competition between the elastic and viscous forces.
The article is organised as follows. The boundary value problem, governing equations, solution approach, and parameters involved in the system are explained in Sec. 2. The collective non-reciprocal motion is analysed in Sec. 3A . The mechanisms that cause the flow are analysed from Eulerian and Lagrangian points-of-view in Secs. 3B1, 3B2, respectively. The dependence of the flow on the system parameters is analysed in Sec. 3C . We finally summarise the results of the analysis in Sec. 4.
PROBLEM DEFINITION
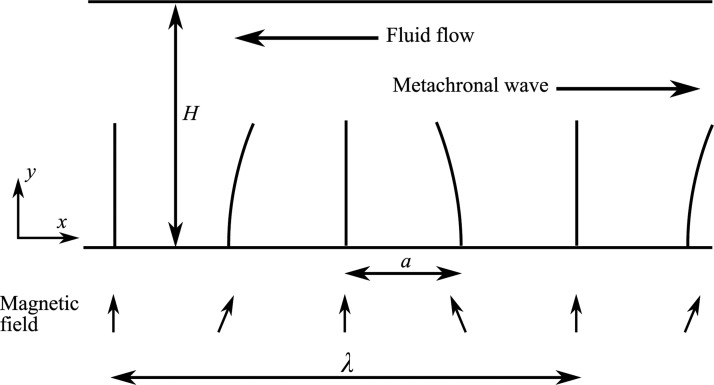
We analyse the flow in an infinitely long channel of height H containing an array of two-dimensional cilia of length L, thickness h, and inter-cilia spacing a, see Fig. 1. The cilia have an elastic modulus E and possess a remanent magnetization of magnitude oriented along their length from the fixed end to the free end. A magnetic field is applied which is uniform over each cilium but with a phase difference between adjacent cilia. The magnetic field experienced by the cilium is
| (1) |
where is the angular velocity, is the time period of oscillation, and the phase . The phase difference between adjacent cilia is . The chosen form of the phase enables the magnetic field to be periodic every cilium, so that the length of the period or the wavelength of the applied magnetic field is . The applied magnetic field has a wave velocity to the right. A similar out-of-phase magnetic field has also been used in a theoretical setting by Gauger et al.10 Experimentally, however, it is not straightforward to create a magnetic field with a phase-lag between neighbouring cilia. It could be realised in an approximate sense, for instance, by using a combination of an external Helmholtz coil (to create ) and by locally actuating the cilia using short solenoids that “wrap-around” the microfluidic channel (to create ). By controlling the current in the solenoids, an out-of-phase magnetic field can be generated that closely resembles the field used for the simulations (see the supplementary material29). The magnetic body couple acting on the cilia can be written as . The velocity of the magnetic couple wave, which causes the out-of-phase motion of the cilia, is also equal to . However, as there are a finite number of cilia per wavelength, the metachronal wave velocity also depends on the cilia spacing a. The metachronal velocity in cilia per seconds can be written as for and for , see Khaderi et al.17 The fluid to be propelled is assumed to be incompressible and Newtonian with a viscosity μ. The cilia are vertically straight when no magnetic field is applied.
Figure 1.
Schematic picture of the problem analysed. We study an infinitely long channel of height H containing equally spaced cilia that are arranged perpendicular to the channel. A magnetic field which varies in space and time is used for actuation. The resulting flow is opposite to the direction of the metachronal wave.
The dimensionless geometric parameter characterises the response of the system together with and . The physical response of the system can be captured through three dimensionless numbers: the fluid number —the ratio of the viscous forces to the elastic forces, the inertia number —the ratio of cilia inertia forces to the elastic forces and the magnetic number —the ratio of magnetic forces to the elastic forces, where E and ρ are the elastic modulus and density of the cilia.16 In this paper, we explore the effect of , , and for a given value of , , and in the limit of low Reynolds numbers.
Governing equations
We now briefly discuss the coupled solid-fluid magneto-mechanical numerical model used to study fluid propulsion by means of magnetically actuated artificial cilia.
Solid dynamic model
We model the cilia as elastic Euler-Bernoulli beams taking into consideration geometric non-linearity in an updated Lagrangian framework. As a starting point for the Euler-Bernoulli beam element formulation, we use the principle of virtual work19 and equate the virtual work of the external forces at time () to the internal work (). The internal virtual work is given by
| (2) |
where u and ν are the axial and transverse displacements of a point on the beam and ρ is the density of the beam. Furthermore, σ is the axial stress and ε is the corresponding strain, given by
The external virtual work is
| (3) |
where and are the magnetic body forces in the axial and transverse directions, is the magnetic body couple in the out-of-plane direction, and are the surface tractions and b is the out-of-plane thickness of the cilia.
We follow the approach used by Annabattula et al.3 to linearise and discretise the principal of virtual work to get,
| (4) |
where K is the stiffness matrix that combines both material and geometric contributions, M is the mass matrix,5 is the external force vector, is the internal force vector, is the nodal displacement increment vector, and is the nodal acceleration vector. The nodal acceleration vector is discretized in time using Newmark’s algorithm (using Newmark’s parameters and ) so that Eq. (4) can be written in terms of the velocity of the beam. The complete discretized equations of motion for the solid mechanics model can be found elsewhere.16
Magnetostatics
To find the resulting magnetic forces, the magnetization of the cilia has to be calculated by solving the Maxwell’s equations in the deformed configuration at every time increment. The Maxwell’s equations for the magnetostatic problem with no external currents are
| (5) |
with the constitutive relation where B is the magnetic flux density (or magnetic induction), H is the magnetic field, M is the magnetization, and is the permeability of vacuum. Equation (5) is solved for M and B using the boundary element method.16 The magnetic couple per unit volume is given by , where has components and . As the simulations are two dimensional, the only non-zero component of magnetic body couple is which is the source for the external virtual work in Eq. (3). Since the applied magnetic field is uniform for each cilium, the magnetic body forces due to field gradients are absent.
Fluid dynamics and solid fluid coupling
We study the flow created by artificial cilia in the limit of low Reynolds number. The fluid is assumed to be Newtonian and incompressible. The physical behaviour of the fluid is governed by the Stokes equation,
| (6) |
where p is the pressure in the fluid, D is the rate of deformation tensor, u is the velocity of the fluid, and μ is the viscosity of the fluid. The set of equations in Eq. (6) is solved using Eulerian finite elements based on the Galerkin method. The fluid domain is discretized into quadrilaterals in which the velocity and pressure of the fluid are interpolated quadratically and linearly, respectively. The velocity is calculated at the vertices, mid-sides, and mid-point of the quadrilateral, and the pressure is calculated at the vertices. The solid and fluid domains are coupled by imposing the constraint that the velocity at the nodes of the solid beam is equal to the velocity of the surrounding fluid (point collocation method). This coupling is established with the help of Lagrange multipliers using the fictitious domain method. Details of the Eulerian finite element model and the coupling procedure can be found in van Loon et al.25
To perform the numerical simulations, we choose a unit-cell whose width is equal to one wavelength containing cilia. The left and right end of the unit-cell are periodic in velocity, while the top and bottom boundaries are no-slip boundaries. We perform simulations for various values of the phase difference , while the inter-cilia spacing is maintained constant. Therefore, as λ is increased the number of cilia in a unit-cell also increases. The top and bottom of the unit-cell are the channel walls, on which no-slip boundary conditions are applied,
while the left and right ends are periodic in velocity
Solution procedure
The solution procedure is as follows. The Maxwell’s equations are solved at every time instant to solve for the magnetic field. From the magnetic field, the magnetic body couple acting on the cilia is calculated and is provided as an external load to the coupled solid-fluid model, which simultaneously solves for the cilia velocity, and the velocity and pressure of the fluid. The velocity of the cilia is integrated using Newmark’s algorithm to obtain its new position, and the procedure is repeated. The particles and streamlines are obtained from the velocity field in the fluid using the visualization software Tecplot.24 Also, here care should be taken to accurately resolve the velocity field.
RESULTS
Collective non-reciprocal motion
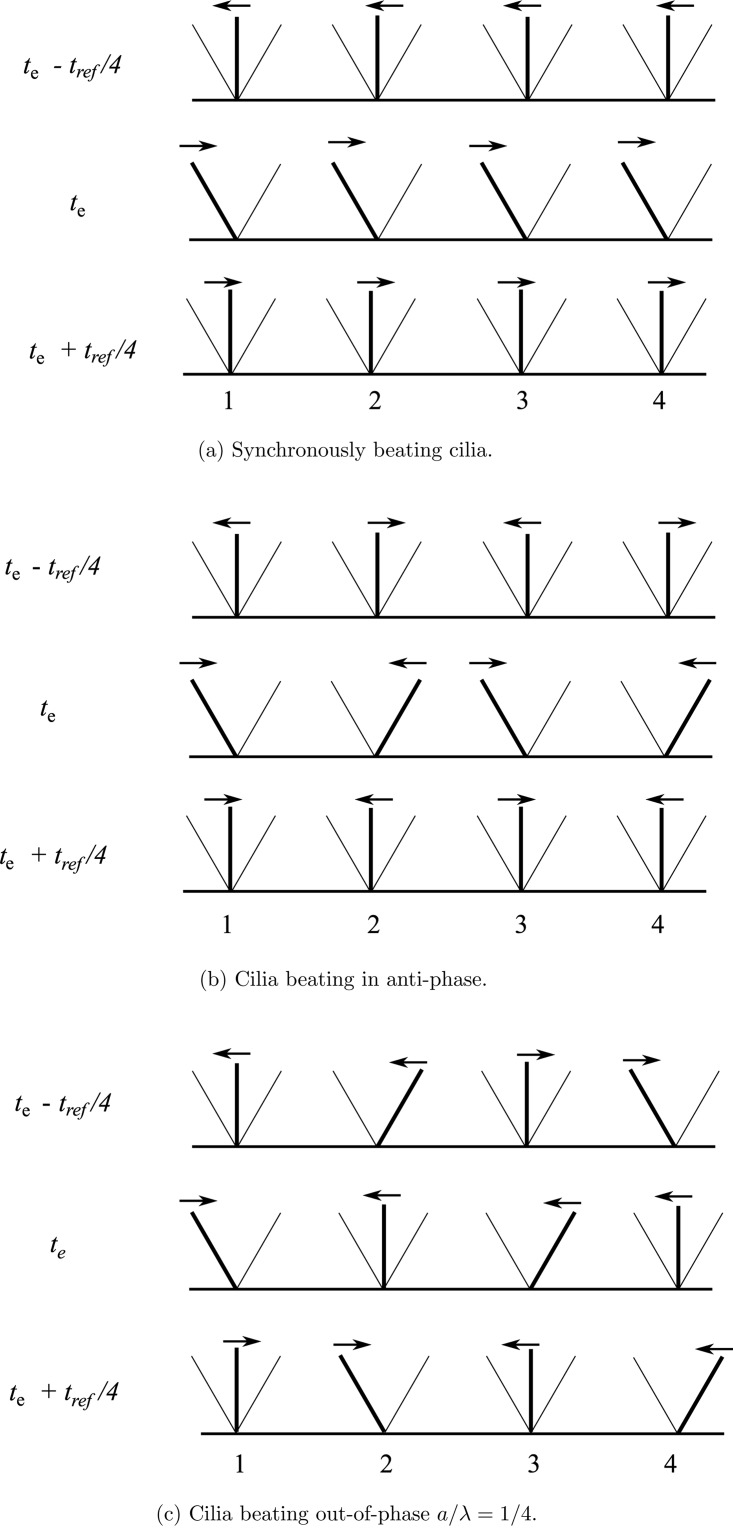
We first show that the out-of-phase motion of the cilia leads to a collective non-reciprocal motion. To elucidate this, we plot the schematic positions of the cilia at time instances after and before the first cilium has reached its extreme position (at time ) in Fig. 2. Note that the cilia will deform by bending—when a magnetic body couple is applied—and will not remain straight as is assumed in this section for simplicity. The thin and thick lines represent the extreme and current positions of the cilia, respectively. The arrows represent the direction of motion of the cilia. We would like to remind that for non-reciprocal motion of an actuator, its position after and before an extreme position is reached should not be identical. In the cases of cilia beating in synchrony and anti-phase, the positions of all the cilia before () and after the extreme position () is the same; hence the motion is reciprocal. However, in the case for cilia moving out-of-phase, even though the positions of the cilia 1 and 3 are identical before and after , the positions of cilia 2 and 4 are not. Therefore, even though every cilium performs a reciprocal motion, the cilia collectively perform a non-reciprocal motion and will cause a net fluid flow in microchannels. The non-reciprocal motion due to the out-of-phase motion may be quantified by the parameter . The collective motion of the cilia is reciprocal for (where m is an integer), otherwise the collective motion is non-reciprocal. The fluid flow due to the non-reciprocal motion is quantitatively analysed in the subsequent sections.
Figure 2.
Schematic positions of the cilia at instances after () and before () the extreme position has been reached by the first cilium at . The time corresponds to the extreme position of the first cilium from the left. The arrows represent the direction of motion of the cilia. In the cases of cilia beating synchronously and anti-phase, the positions of all the cilia before and after the extreme position is the same; hence the motion is reciprocal. However, it is not the case for cilia moving out-of-phase; hence the motion is non-reciprocal.
The fundamental mechanism
Eulerian point-of-view
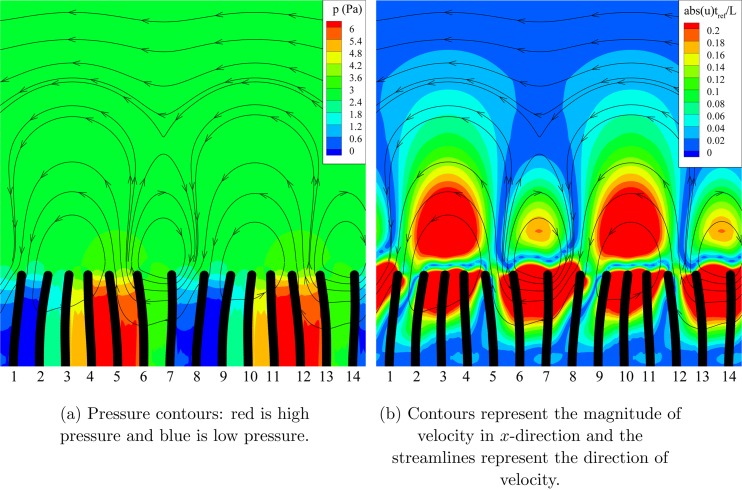
To illustrate the fundamental mechanism that creates the flow, we take , , , , , and (based on ). As , the metachronal wave travels to the right with a speed . Figure 3a shows the pressure contours with the streamlines superimposed and Fig. 3b shows the contours of the absolute value of the horizontal component of the velocity. For clarity, the results are shown for two unit-cells. Because of the travelling magnetic wave and periodicity of the system, the pressure and velocity profiles in the channel remain unchanged in time, but travel with a constant velocity in the direction of the applied magnetic wave (to the right).
Figure 3.
Fundamental mechanism causing fluid flow: (a) Contours of pressure and (b) Contours of absolute velocity in x-direction for and (wave moving to the right) at . Due to the velocity of cilia, regions of positive and negative pressure are established in the channel. The deformed position of the cilia causes a lower pressure gradient in direction of the wave compared to that of in the opposite direction. This leads to a high velocity and a net flow to the left.
At the instant depicted, cilia 2, 3, 4 and 9, 10, 11 move to the right, while cilia 6, 7 and 13, 14 move to the left. The other cilia are nearly stationary (zero velocity). Due to the instantaneous velocity of the cilia, high pressure (hp) and low pressure (lp) regions develop (red and blue regions in Fig. 3a). Fluid is squeezed out from the hp region and sucked in by the lp regions, as a result of which a series of counter-rotating vortices are formed in the channel. Since the distance between the hp and lp regions opposite to the wave direction is smaller, the pressure gradient is larger, so that the counter-clockwise vortices are stronger (see Fig. 3b). As a result, the velocity distribution has a dominant horizontal component to the left. Integrating the velocity profile over the channel height results in a net flux to the left. Conservation of mass dictates that the flux at every vertical section through the channel is the same. Since the entire periodic profile, as depicted in Fig. 3, travels continuously to the right at a constant pace, the flux remains constant in time. Clearly, the flux magnitude and direction can be directly deduced from the instantaneous pressure distribution profile of Fig. 3 as analysed in the following.
Fluid flow occurs in the direction opposite to the net pressure gradient. This pressure gradient is governed by the magnitude of the pressure in the lp and hp regions and the distance between them. The former is governed by the velocity of the individual cilia, whereas the latter is determined by the deflection δ of the cilia tip. Since the velocity and displacements of the cilia are controlled by the magnetic field and its rate of change, it can be deduced that for a considerably smaller than λ the net pressure gradient scales with (see Appendix). As this pressure gradient is positive, the flow occurs in the negative x-direction. Thus, the flow direction is opposite to the metachronal wave, and scales with the square of the amplitude of deflection. When the direction of the applied magnetic wave is reversed, the pressure profile, which is dictated by the cilia velocity, remains alternating. However, the deformed configuration of the cilia changes in such a way that the net pressure gradient is now negative; this creates a flow to the right (again opposite to the metachronal wave). Fluid flow created by oscillating cilia whose motion is kinematically prescribed has been analysed recently using a continuum approach.14 The formation of the vortices was also observed in this work. A rigorous mathematical analysis of the fluid flow (following similar scaling arguments as Taylor23) induced by a longitudinally oscillating sheet whose material particles comprise of the tip of the cilia also predicts that the flow will occur in the direction opposite to the metachronal wave.4
Lagrangian point-of-view
The previous analysis focussed on the channel flow from an Eulerian point-of-view. Instead, we can also adopt a Lagrangian view point and track the motion of fluid particles in time. In the following, all the parameters of the Sec. 3B1 are kept constant, except for H, which we now choose to be . Figure 4 shows a portion of the region between the tips of the cilia and the top boundary. We follow the motion of the fluid particles (that initially form a straight vertical line) when they come under the influence of the travelling vortices (see Fig. 4). The contours represent the absolute velocity in the x-direction, and the direction of velocity is represented by the streamlines. From the velocity field, we can see that the out-of-phase motion of cilia creates a series of counter-acting vortices, and that the velocity field travels to the right, which is also the direction of propagation of the applied magnetic field wave.
Figure 4.
Motion of particles with time: The field-of-view is the region between the oscillating end of cilia and top boundary of the unit-cell with the bottom left corner at and the top right corner at . The velocity in the channel direction is larger in the direction opposite to the wave than in the direction of the wave. The white curves represent the trajectory of particles and the black dots represent the particles. Particles near the cilia move unidirectionally and show larger displacement, whereas the particles near the top boundary do not show any displacement. An animation of the motion of the fluid particles is added as a supporting information (enhanced online) .
We focus our attention on the second particle from the bottom. At the particle is between two vortices. The velocity of the particle is such that it moves downwards. As time progresses, at the position of the particle is such that it has a low velocity to the right due to the presence of the clockwise vortex. At , the particle moves away from the influence of the clockwise vortex, towards the counter-clockwise vortex. Now the particle has a velocity such that it moves upwards. At , when the particle is under the influence of the stronger counter-clockwise vortex, it has a higher velocity compared to the instance when the particle was under the influence of less strong clockwise vortex (compare Figs. 4b, 4c). Therefore, the particle effectively moves to the left. The displacement perpendicular to the channel is less for the particles near the top boundary. This leads to equal velocities in the channel direction when they come under the influence of the clockwise and counterclockwise vortices, which results in no net displacement of the particles near the top boundary.
It can be seen that the fluid particle near the free end of the cilia moves unidirectionally and that its displacement is much larger compared to the displacement of the rest of the particles. Therefore, the contribution to the flow from the fluid particles near the cilia is much larger compared to other particles. This results in a flow that is nearly unidirectional, even though the cilia motion is oscillatory. An unidirectional flow is also observed when the cilia motion is non-reciprocal in the presence of metachronal waves and inertia.15 A similar approach (Lagrangian point-of-view) was used by Ehlers et al.7 to analyse the swimming of microorganisms (based on tangential travelling waves).
Parametric study
We now characterise the flow generated by the cilia as a function of the system parameters such as the cilia spacing a, wavelength λ, amplitude of cilia deflection, and fluid number . The output of the cilia is quantified by the area flow created per cycle, which is found by integrating the instantaneous velocity flux through the channel over a representative cycle. The nature of the fluid flow, as seen in Sec. 3B2, is unidirectional. We focus our attention on the cases where the direction of the metachronal wave velocity is positive, i.e., , and perform the analysis for , , , and unless mentioned otherwise.
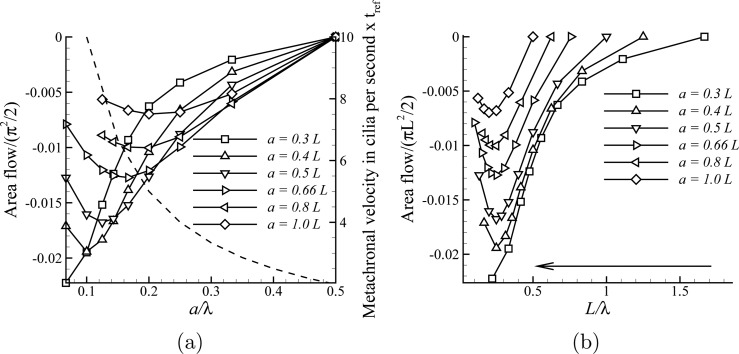
Figure 5a shows the flow and the metachronal wave velocity as a function of . When , the cilia move in-phase (not shown). When , the positive wave velocity and the negative wave velocity are equal and this leads to a standing wave (see Khaderi et al.17) that causes the cilia motion to be reciprocal (see Fig. 2b). Under these conditions no fluid flow is observed. As the magnetic wave travels to the right (see Fig. 1), the fluid flows to the left; the opposite occurs for . To get more insight into the behaviour of the system, we plot the flow as a function of for the cases shown in Figs. 5a, 5b. The arrow shows the direction of increasing λ. The fluid flow increases when the inter-cilia spacing is decreased, and for a given inter-cilia spacing, the flow initially increases with λ, reaches a maximum at and then decreases.
Figure 5.
Flow as a function of (a) phase difference and (b) inverse wavelength for various cilia densities . The fluid flows in a direction opposite to the metachronal velocity (shown using dashed lines in (a)). The flow is maximum when . The arrow shows the direction of increase of λ.
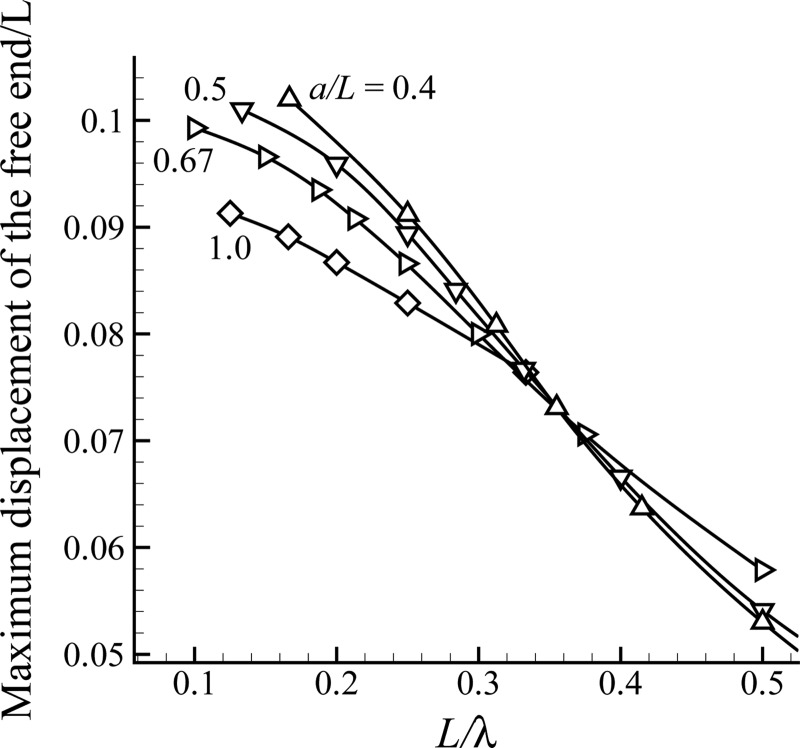
As shown in Appendix the pressure gradient responsible for the flow increases when the wavelength decreases, as well as when the deflection of the cilia increases. However, there is an additional dependence. When the wavelength of the magnetic field is increased in Fig. 5b for a particular cilia spacing, the pressure between the cilia decreases, which reduces the hydrodynamic drag and causes an increased deformation of the cilia (see Fig. 6). On the other hand, the pressure gradient will decrease with an increase in the wavelength,30 so that the flow created is due to the relative competition between these two effects. The deflection effect dominates when the wavelength is small, creating an increased flow as we increase the wavelength until . When we increase the wavelength any further, the effect of the increasing deflection is overcome by the decreasing pressure gradient, which causes the flow to decrease. This is in contrast to the situation where the cilia sweep an asymmetric area (see Khaderi et al.17), where it is shown that the flow created does not depend on the phase difference between adjacent cilia. This is due to the different mechanisms that drive the flow: The pressure gradient in the current situation and the asymmetric area in the work of Khaderi et al.17
Figure 6.
Maximum transverse displacement as a function of for different cilia spacings (). When is large the phase difference between adjacent cilia is large, causing them to move against each other, which leads to high drag forces on the cilia causing low deformation.
To investigate the possible contribution of shape asymmetry to the flow generated, we have calculated the area swept by the tip of the cilia. For all the cases reported the normalized swept area (area swept/) is on the order of , which can be estimated16 to create a flow that is four orders of magnitude smaller than the flow reported in the current manuscript. Clearly, the fluid transport generated by shape asymmetry is negligible.
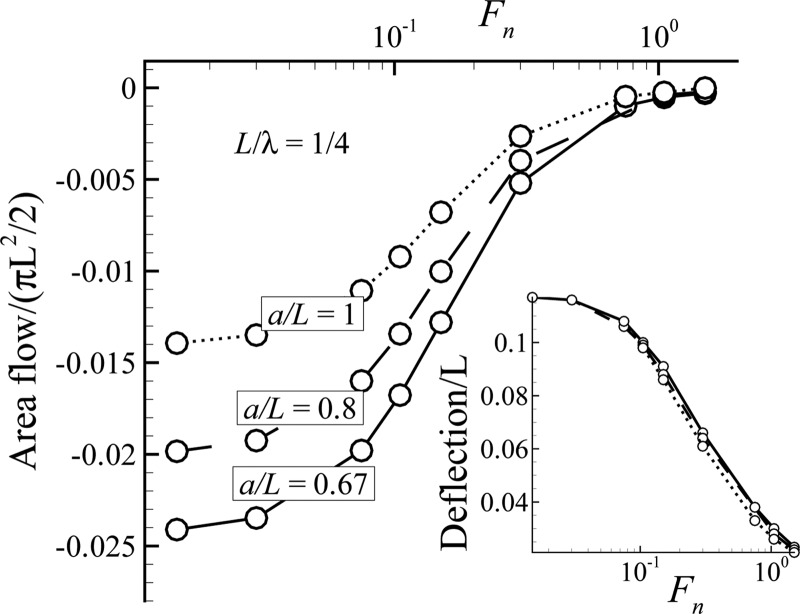
The flow as a function of the fluid number () for various cilia spacings at is shown in Fig. 7; the flow decreases with an increase in the fluid number. As the viscous forces increase with the fluid number, the cilia exhibit lower deflections when is increased (see the inset in Fig. 7). As the pressure gradient scales with the cilia deflection, the flow created decreases with the deflection.
Figure 7.
Flow as a function of the fluid number () for various cilia spacing at . The maximum transverse displacement of the free end is shown as an inset.
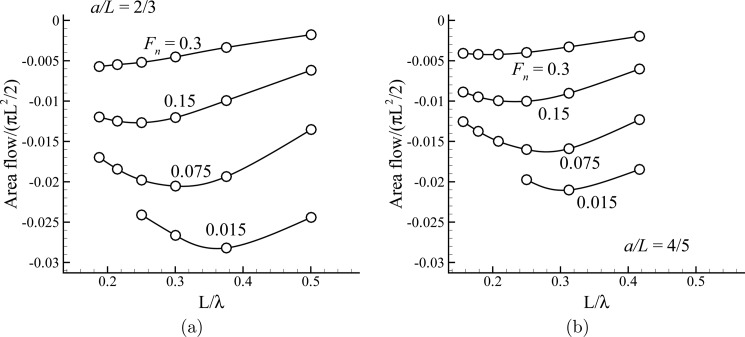
The flow as a function of for different fluid numbers is shown in Fig. 8 for various cilia spacings. The flow reaches a maximum at different values of for different fluid numbers. The maximum flow occurs at shorter wavelengths (i.e., at larger values) as the fluid number is reduced. The tip displacements corresponding to Fig. 8 are shown in Table TABLE I.. The percentage increase in the displacement decreases as the fluid number is decreased. When the wavelength is increased, as mentioned earlier, the flow increases because of the increase of the displacement and decreases due to the decreased pressure gradient. However, as the fluid number is decreased, the increase of flow because of the increase of the displacement is limited. Therefore, the maximum fluid transport takes place at smaller wavelengths (i.e., at larger values).
Figure 8.
Fluid transported as a function of for different fluid numbers and cilia spacings.
TABLE I.
Maximum transverse displacement (normalised with L) for the cases shown in Fig. 8. Also shown is the percentage increase in the displacements as the wavelength is increased.
| 0.333 | 0.0345 | 0.0579 | 0.868 | 0.040 | 0.0672 | 0.0945 |
| 0.250 | 0.0426 | 0.0706 | 0.969 | 0.047 | 0.0775 | 0.1015 |
| 0.200 | 0.0498 | 0.0800 | 1.030 | 0.053 | 0.0843 | 0.1055 |
| 0.167 | 0.0556 | 0.0866 | 1.060 | 0.058 | 0.0886 | 0.1077 |
| 0.143 | 0.0599 | 0.0908 | 1.087 | 0.061 | 0.0912 | 0.1090 |
| 0.125 | 0.0632 | 0.0935 | 1.100 | 0.063 | 0.0957 | 0.1098 |
| Percentage increase | 83.1 | 61.4 | 26.7 | 56.6 | 42.4 | 16.2 |
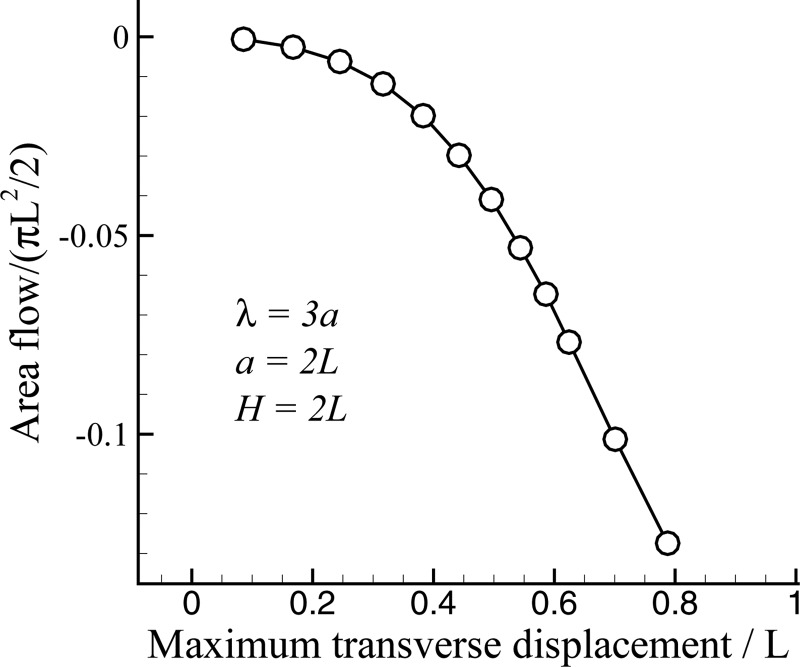
When , the fluid experiences an oscillating surface whose material particles are made up of the tip of cilia. The velocity of propulsion in such a case is given by the envelope theory under the assumption that the cilia spacing is much smaller than the wavelength. Brennen4 has shown that for a continuous distribution of cilia, the fluid velocity scales with the inverse square of the wavelength, the frequency of oscillation ω, and the square of the amplitude of oscillation (in accordance with the physical scaling laws derived earlier by Taylor23). Moreover, the flow is in the direction opposite to the wave velocity. Our model also captures all these aspects. In the following, we show that the flow scales with the square of the amplitude of oscillation even at large amplitudes of deflection and spacing of cilia ().
To do so, we examine the fluid flow dependence on the magnitude of the transverse deflection of the cilia. We take the case of and . The magnitude of displacement is increased by increasing the magnetic number from 2.25 to 34. The flow as a function of displacement is shown in Fig. 9. The flow has a quadratic dependence on the deflection until the deflection is 40% of the cilia length.
Figure 9.
Flow as a function of deflection.
CONCLUSIONS
In this article, we analysed the fluid transport created by cilia that beat symmetrically and out-of-phase when actuated by a non-uniform magnetic field, leading to the formation of metachronal waves. Although at the scale of individual cilia the beating is reciprocal, because of the metachronal waves the cilia collectively exhibit a non-reciprocal motion. Using a magneto-mechanical solid-fluid numerical model we analysed the fundamental mechanisms that cause this fluid flow. The out-of-phase motion of cilia creates a net pressure gradient, which results in a unidirectional flow whose direction is opposite to the direction of the wave. The flow increases with the tip deflection of cilia and decreases with the wavelength. Analysis of the motion of fluid particles reveals that the major contribution to the fluid flow comes from the particles located near the free end of the cilia. The flow created reaches a maximum value at critical values of wavelengths (), which decreases with the fluid number.
APPENDIX: CALCULATION OF THE NET PRESSURE GRADIENT IN THE UNIT-CELL
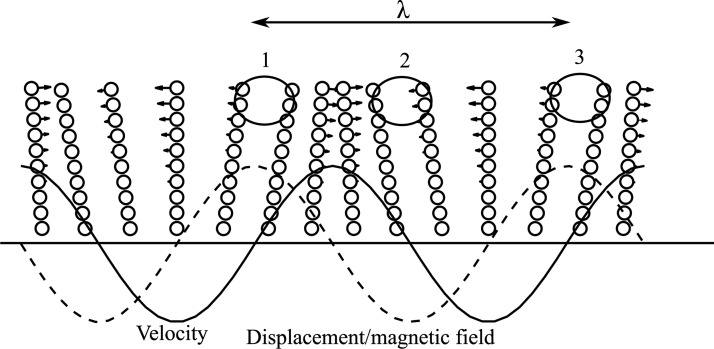
In this appendix, we derive an expression for the net pressure gradient in the channel due to the out-of-phase motion of cilia. For simplicity, we take the case where ; i.e., the metachronal wave velocity and the applied wave velocity are the same (to the right). The orientation of the cilia is dictated by the magnetic field vector, while their velocity is dictated by the rate of change of the magnetic field vector. The current x position of the tip of a cilium is and its velocity is , where is assumed to scale with the amplitude of the applied magnetic field in the x-direction and is the position of the cilia base. Figure 10 shows the current velocity (solid lines) and displacement (dashed lines) for , with the wave travelling to the right. The pressure will be positive when two cilia come close and will be negative when they move apart, i.e., the positive and negative pressures will occur when the velocity gradient is negative and positive, respectively. At any time t, this happens at (negative pressure), (positive pressure), and (negative pressure).
Figure 10.
Velocity (arrows and solid lines) and deformation (dashed line) of the cilia at any time instant, neglecting the inter-cilium interaction.
The position of cilia with its velocity at a particular time instance is shown in Fig. 10. It can be seen that two neighbouring cilia move apart in regions 1 and 3, thereby generating a negative pressure −p. In region 2, two neighbouring cilia come closer, this generates a positive pressure p. (We have assumed that the positive pressure is equal to the negative pressure). At any time t, the position of region 1 is
| (A1) |
Similarly, the respective positions of the regions 2 and 3 are
| (A2) |
| (A3) |
The pressure gradient between regions 1 and 2 can be written to be proportional to
and the pressure gradient between the region 2 and 3 can be written to be proportional to
The average pressure gradient in the unit-cell is now given by,
By invoking that p scales with , it can be seen that the pressure gradient that drives the flow increases with an increase of the cilia deflection and with a decrease of the wavelength,
Assuming small cilia deflection (), we observe that the average pressure gradient scales with . Therefore, the pressure gradient is positive when the wave is moving in the positive x-direction; this creates a flow in the negative x-direction. Although the applicability of the expression for the pressure gradient is limited to large wavelengths and small cilia deflections, it explains all the trends observed in the simulations (the direction of flow, the increase in flow because of decreasing wavelength and increasing cilia deflection).
References
- Alexeev A., Yeomans J. M., and Balazs A. C., Langmuir 24, 12102 (2008). 10.1021/la801907x [DOI] [PubMed] [Google Scholar]
- Alexeev A., Yeomans J. M., and Balazs A. C., Langmuir 24(21), 12102 (2008). 10.1021/la801907x [DOI] [PubMed] [Google Scholar]
- Annabattula R. K., Huck W. T. S., and Onck P. R., J. Mech. Phys. Solids 58, 447 (2010). 10.1016/j.jmps.2010.02.004 [DOI] [Google Scholar]
- Brennen C., J. Fluid Mech. 65(04), 799 (1974). 10.1017/S0022112074001662 [DOI] [Google Scholar]
- Cook Robert D., Malkus D. S., Plesha M. E., Malkus D. S., and Plesha M. E., Concepts and Applications of Finite Element Analysis (Wiley, New York, 2001). [Google Scholar]
- den Toonder Jaap, Bos Femke, Broer D., Filippini L., Gillies M., de Goede Judith, Mol Titie, Reijme Mireille, Talen W., Wilderbeek H., Khatavkar V., and Anderson P., Lab Chip 8(4), 533 (2008). 10.1039/b717681c [DOI] [PubMed] [Google Scholar]
- Ehlers K. M., Samuel A. D., Berg H. C., and Montgomery R., Proc. Natl. Acad. Sci. USA 93(16), 8340 (1996). 10.1073/pnas.93.16.8340 [DOI] [PMC free article] [PubMed] [Google Scholar]
- Evans B. A., Shields A. R., Lloyd Carroll R., Washburn S., Falvo M. R., and Superfine R., Nano Letters 7(5), 1428 (2007). 10.1021/nl070190c [DOI] [PubMed] [Google Scholar]
- Fahrni F., Prins M. W. J., and van IJzendoorn Leo J., Lab Chip 9, 3413 (2009). 10.1039/b908578e [DOI] [PubMed] [Google Scholar]
- Gauger E. M., Downton M. T., and Stark H., Eur. Phys. J. E 28, 231 (2009). 10.1140/epje/i2008-10388-1 [DOI] [PubMed] [Google Scholar]
- Ghosh R., Buxton G. A., Berk Usta O., Balazs Anna C., and Alexeev Alexander, Langmuir 26, 2963 (2010). 10.1021/la902926w [DOI] [PubMed] [Google Scholar]
- Gueron S. and Levit-Gurevich K., Proc. Natl. Acad. Sci. USA 96(22), 12240 (1999). 10.1073/pnas.96.22.12240 [DOI] [PMC free article] [PubMed] [Google Scholar]
- Gueron S., Levit-Gurevich K., Liron N., and Blum J. J., Proc. Natl. Acad. Sci. USA 94(12), 6001 (1997). 10.1073/pnas.94.12.6001 [DOI] [PMC free article] [PubMed] [Google Scholar]
- Hussong J., Breugem W. P., and Westerweel J., J. Fluid Mech. 684, 137 (2011) 10.1017/jfm.2011.282. [DOI] [Google Scholar]
- Khaderi S. N., Baltussen M. G. H. M., Anderson P. D., den Toonder J. M. J., and Onck P. R., Phys. Rev. E 82, 027302 (2010). 10.1103/PhysRevE.82.027302 [DOI] [PubMed] [Google Scholar]
- Khaderi S. N., Baltussen M. G. H. M., Anderson P. D., Ioan D., den Toonder J. M. J., and Onck P. R., Phys. Rev. E 79(4), 046304 (2009). 10.1103/PhysRevE.79.046304 [DOI] [PubMed] [Google Scholar]
- Khaderi S. N., den Toonder J. M. J., and Onck P. R., J. Fluid Mech. 688, 44 (2011) 10.1017/jfm.2011.355. [DOI] [Google Scholar]
- Kim Y. W. and Netz R. R., Phys. Rev. Lett. 96(15), 158101 (2006). 10.1103/PhysRevLett.96.158101 [DOI] [PubMed] [Google Scholar]
- Malvern L. E., Introduction to the Mechanics of a Continuous Medium (Prentice-Hall, 1977). [Google Scholar]
- Oh Kieseok, Chung Jae-Hyun, Devasia S., and Riley J. J., Lab Chip 9(11), 1561 (2009). 10.1039/b817409a [DOI] [PubMed] [Google Scholar]
- Purcell E. M., Am. J. Phys. 45(1), 3 (1977). 10.1119/1.10903 [DOI] [Google Scholar]
- Shields A. R., Fiser B. L., Evans B. A., Falvo M. R., Washburn S., and Superfine R., Proc. Natl. Acad. Sci. 107(36), 15670 10.1073/pnas.1005127107(2010). [DOI] [PMC free article] [PubMed] [Google Scholar]
- Taylor G., Proc. R. Soc. London A 209, 447 (1951) 10.1098/rspa.1951.0218 . [DOI] [Google Scholar]
- Tecplot, Tec360 User Manual (2008).
- van Loon R., Anderson P. D., and van de Vosse F. N., J. Comput. Phys. 217, 806 (2006). 10.1016/j.jcp.2006.01.032 [DOI] [Google Scholar]
- van Oosten Casper L., Bastiaansen Cees W. M., and Broer Dirk J., Nature Mater. 8, 677 (2009). 10.1038/nmat2487 [DOI] [PubMed] [Google Scholar]
- Vilfan A. and Jülicher F., Phys. Rev. Lett. 96(5), 058102 (2006). 10.1103/PhysRevLett.96.058102 [DOI] [PubMed] [Google Scholar]
- Vilfan M., Potocnik A., Kavcic B., Osterman N., Poberaj I., Vilfan A., and Babic D., Proc. Natl. Acad. Sci. 107, 1844 (2010). 10.1073/pnas.0906819106 [DOI] [PMC free article] [PubMed] [Google Scholar]
- See supplementary material at http://dx.doi.org/10.1063/1.3676068 for the simulations of the magnetic field caused by the solenoids.
- Note that the pressure gradient will continue to decrease with an increase in wavelength, whereas its increase because of the increased cilia deflection is limited.


