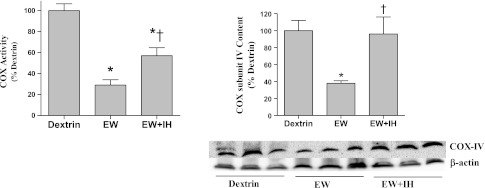
Fig. 4.
Cytochrome c oxidase content. COX activity (left) and COX subunit IV protein content (right) were measured by spectrophotometry and immunoblot, respectively, in cerebelli obtained at 3 wk of the second EW period. Loading control for immunoblots was β-actin. Values are means ± SE for 4–6 rats/group. *Significant difference vs. dextrin control (P < 0.005). †Significant difference vs. EW (P < 0.01).

