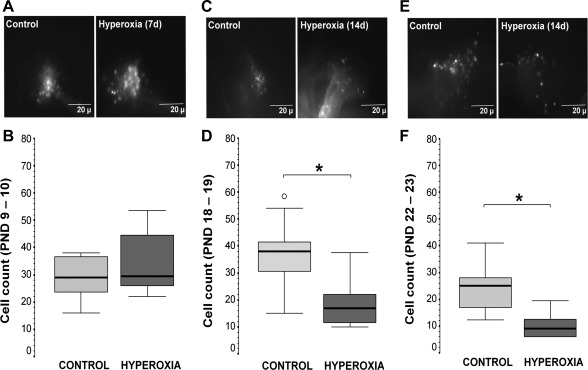
Fig. 1.
Representative photomicrographs of fluorescently labeled cells in the petrosal ganglion (en bloc), which were labeled retrogradely using rhodamine dextran crystals applied to the fenestrated carotid body (CB) from newborn rats after 7-day hyperoxic exposure at postnatal development (PND) postnatal day (p)9–10 (A) and after 14 days exposure at p18–19 (C) and p22–23 (E) and their respective box-and-whisker plots showing the count of chemoafferent neurons in normoxic control (light gray) and hyperoxic (dark gray) animals (B, D, and F). Percentiles [75th and 25th; interquartile range (IQR)] define the upper and lower limits of the box, and the median is represented as the line inside of the box. o, Outliers. *P < 0.05 vs. control; Mann-Whitney U test (n = 7–10/group).

