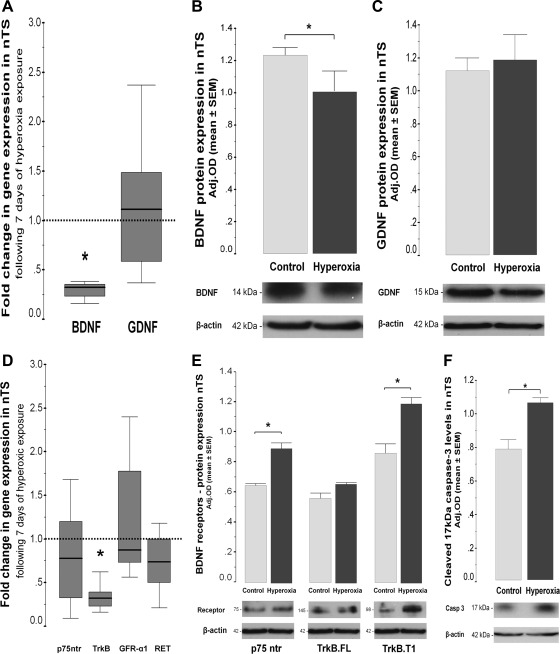
Fig. 3.
BDNF and GDNF gene (A) expression, as well as BDNF (B) and GDNF (C) protein expression (Western blot in 32% SDS-PAGE) in nucleus tractus solitarii (nTS) after 7-day hyperoxic exposure. p75 neurotrophic receptor (p75ntr), tropomyosin kinase B (TrkB), GDNF receptor α1 (GFR-α1), and rearranged during transfection (RET) receptor expression is shown (D). p75ntr and full-length (TrkB.FL) and truncated (TrkB.T1) TrkB protein expression in 15% SDS-PAGE is also shown (E). Cleaved, active 17 kDa caspase-3 is shown (F). Gene expression is represented as box-and-whisker plots, 75th and 25th percentiles (IQR) define the upper and lower limits of the box, and the median is represented as the line inside of the box. For gene expression, the box represents the hyperoxic group, whereas the discontinued line represents the baseline expression given by the normoxic control group. *P < 0.05 vs. control group by Mann-Whitney U test (n = 6/group). Bar graphs represent mean ± SE, showing changes in protein expression (Western blot). Optical densitites (ODs) are adjusted (Adj. OD) for loading using β-actin. *P < 0.05 vs. control, unpaired t-test (n = 4/group).

