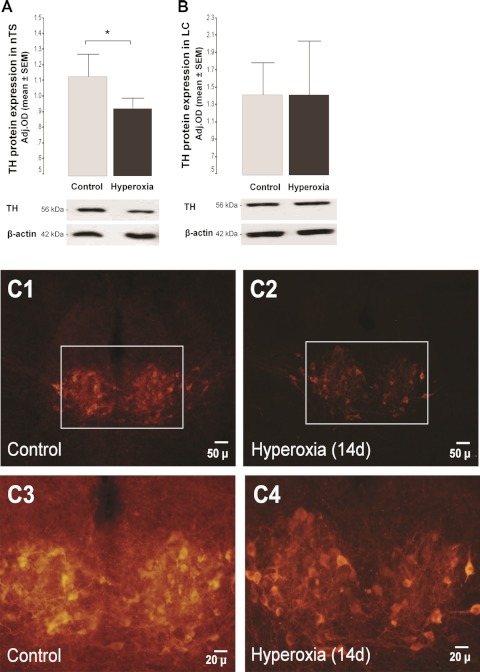
Fig. 4.
Bar graph showing changes in protein expression (Western blot) for tyrosine hydroxylase (TH) in the nTS (A) and locus coeruleus (LC; B) after 14-day hyperoxic exposure, followed by 7–8 days of normoxic exposure. Adj. OD for loading using β-actin. *P < 0.05 (vs. control by unpaired t-test; n = 6/group). Representative sections at the level of the nuclei of nTS from newborn rats at p22, following 14 days of hyperoxic exposure, showing TH+ cells by immunohistochemistry at 2 magnifications (C).

