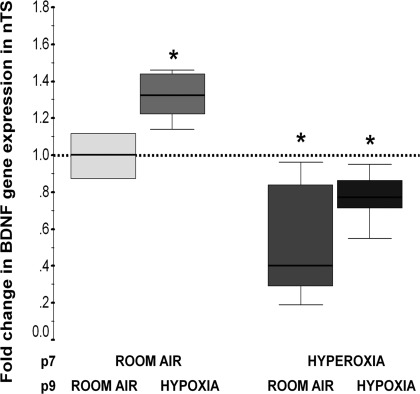
Fig. 5.
Change in BDNF gene expression following 15 min of hypoxia [fraction of inspired oxygen (FiO2) 0.08] or room air (RA) at p9 in animals previously exposed to normoxia or hyperoxia (FiO2 0.60) for 7 days (until p7). All comparisons are made with animals exposed exclusively to RA and represented as the first box sitting at 1 (discontinued line). Fold change in gene expression relative to exclusive RA (comparison group) is represented as a box-and-whisker plot, with 75th and 25th percentiles (IQR) defining the upper and lower limits of the box and the line inside of the box representing the median. *P < 0.05 vs. control group by Mann-Whitney U test (n = 5/group).

