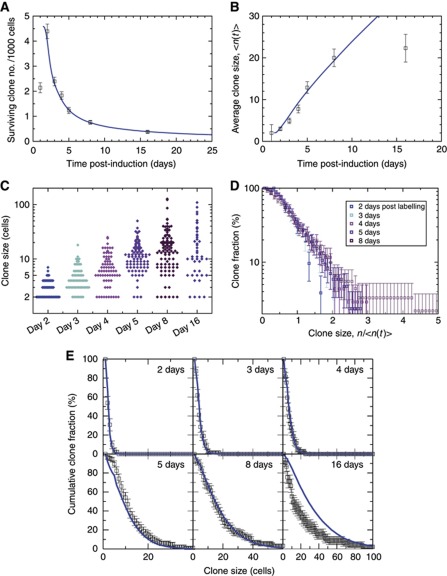
Figure 2.
Long-term clone tracing shows loss and replacement with scaling behaviour. Blue curves show the predictions of the theoretical model for λ=2.5/day and r=0.1 (see main text). Error bars denote standard errors. To focus on ISC-derived clones, clone size distributions (B–E) consider only clones of two cells or more (see main text). (A, B) Evolution of clone density (A) and average clonal size (B). At maximal density (day 2), there is roughly one clone per 40 ISCs. To fit the theoretical curves (blue), we suppose that the induction frequency is 4.6 clones/1000 cells, and that the clonal expansion begins at 1.2 days (Supplementary Methods). (C) Raw clone size data between 2 and 16 days after labelling. Each diamond corresponds to one clone. (D) Plotted as a function of n/<n(t)>, the cumulative clone size distributions C n(t) (shown in E) derived from (C) converge at longer times onto a single scaling curve. This result shows that, despite the rapid increase in the average clone size, the chance of finding a clone larger than some multiple of the average remains constant over time. By presenting the data on a logarithmic scale, it is apparent that the cumulative size distribution follows an approximate exponential dependence on n/<n(t)>. (E) A comparison of the cumulative clone size distribution, C n(t), to the model defined in the main text shows an excellent agreement of theory (blue curve) with the data (points) both at short times and in the scaling regime. At 16 days post induction, the data depart from the predicted scaling behaviour of the model (see main text).

