Figure 7.
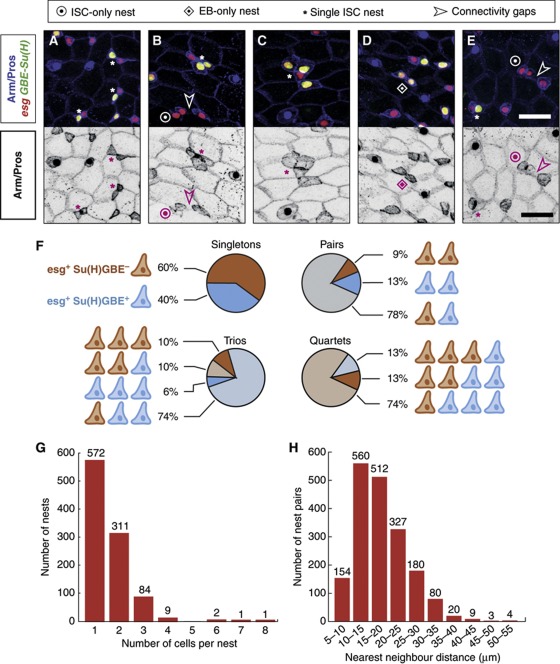
Nests of esg+ cells are variable in composition and size. (A–E) esg+ cell nests defined by Arm/β-catenin contacts (depicted separately in black/white panels). Bar in (E) is 20 μm. ISCs appear in red (esg+) and EBs in yellow (esg+ Su(H)GBE+). (A-C) Nests containing one ISC and one (A), two (B) or three (C) EBs. (D, E) A two-EB and a two-ISC nest, respectively (see also B). Note in (E) the nearby ISC/EB pair demonstrating that Su(H)GBE-GFP signal was detectable in this field of view. Connectivity gaps between esg+ cells are shown where relevant. (F) Relative frequencies of observed compositions, in ISCs and EBs, of the nests containing one to four cells. (G) Histogram depicting the observed counts of nest sizes. (H) Distances between nearest pairs of nests, binned in intervals of 5 μm.

