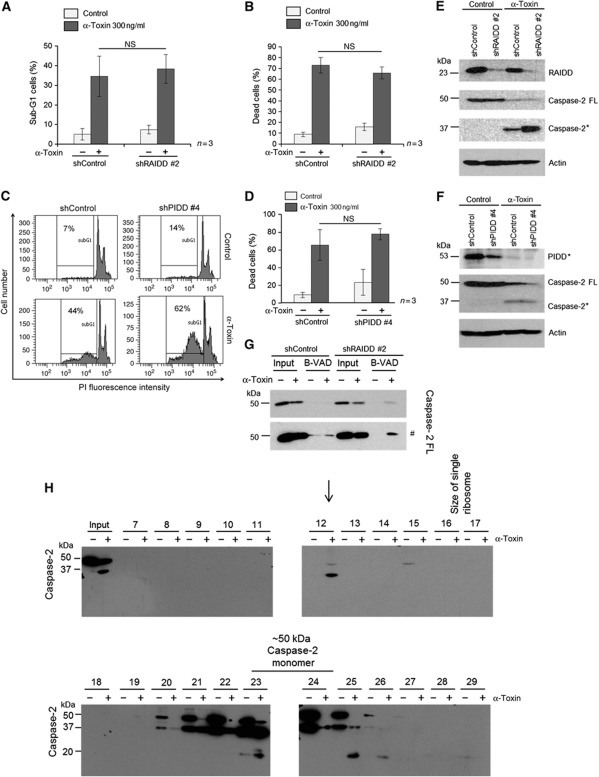
Figure 6.
α-Toxin-mediated caspase-2 activation is independent of PIDDosome. HeLa cells stably expressing scrambled control or RAIDD shRNAs are treated with or without α-toxin (300 ng/ml) for 8 h and subjected to Sub-G1 or treated for 24 h and subjected to annexin-V, PI staining. Percentage of cells representing sub-G1 population is presented in A, and the percentage of cells displaying both annexin-V single positivity and annexin-V, PI double positivity is presented in B. Shown are data from three independent experiments. Error bars represent±s.d. of the mean. (C) Representative experiment from sub-G1 analysis of control and PIDD-depleted cells after α-toxin treatment (8 h, 300 ng/ml). (D) Control and PIDD-depleted HeLa cells were treated with α-toxin (24 h, 300 ng/ml) and the percentage of cells displaying annexin-V single positivity and annexin-V, PI double positivity is depicted. Shown are data from three independent experiments (NS—not significant). HeLa cells stably expressing control or RAIDD (E) or PIDD (F) shRNAs were subjected to α-toxin treatment (24 h, 300 ng/ml), and processing of caspase-2 was monitored by immunoblots. (FL—full–length protein, *—processed form). (G) Control and RAIDD-depleted HeLa cells were subjected to biotin-VAD analysis, as mentioned in the methods section. The presence of caspase-2 was monitored in the biotin-VAD (B-VAD) precipitates by immunoblot analysis (# denoted the higher exposure of blots presented above). (H) Western blot analysis of various fractions obtained after size exclusion chromatography. Cell lysates from HeLa cells treated with or without α-toxin (8 h, 300 ng/ml) are subjected to gel filtration analysis, as mentioned in the methods section. The proteins in the individual fractions were precipitated with TCA, and the presence of caspase-2 was monitored by immunoblot analysis, as mentioned in the methods section. Processed form of caspase-2 consistently eluted in fraction #12 in α-toxin-treated cells. Single ribosomes (∼2.3 MDa) eluted around fractions 16–17. The occurrence of processed protease in non-treated cell lysates is most likely caused by the sample handling during preparation for the gel filtration experiment, as basically no activated caspase-2 is visible in the lane of a sample frozen directly after cell lysis (input lane) or in western blot shown in Figure 2A. Figure source data can be found with the Supplementary data.

