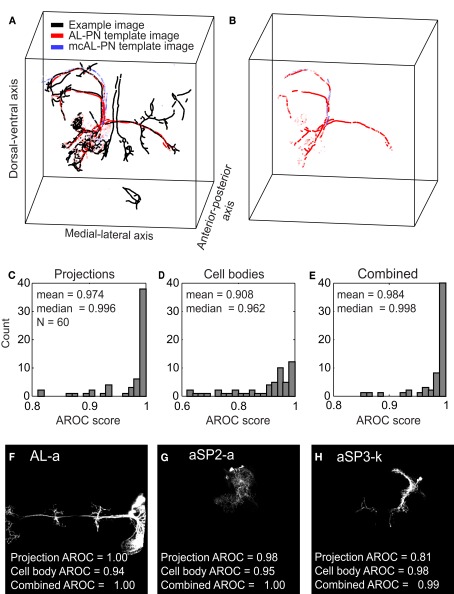
Figure 3.
Assessment of the clone identification algorithm using cross-validation. (A) A processed test image (black points) containing an AL-PN clone is compared against a AL-PN template image (red points) and a mcAL-PN template image (blue points). The brightness of the red and blue points correspond to the mutual information of the point. (B) Same as (A), except only those points from the two template images that matched a point in the test image are shown.(C) Distribution of projection AROC scores for the 60 clones. (D) Same as (C), except showing the cell body AROC scores. (E) Same as (C), except showing the combined AROC score. (F–H) Z-projections of three example clones with variable projection and cell body AROC scores.

