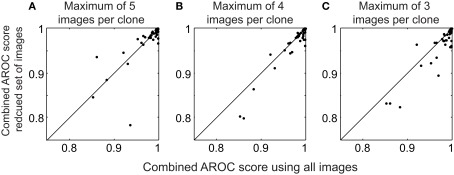
Figure 4.
Performance using a limited set of images in the clone templates. (A) Scatter plot of the combined AROC scores using a maximum of five images per clone template compared to the combined AROC scores using all images. (B,C) Same as (A), except using a maximum of 4 and 3 images to form the templates, respectively.

