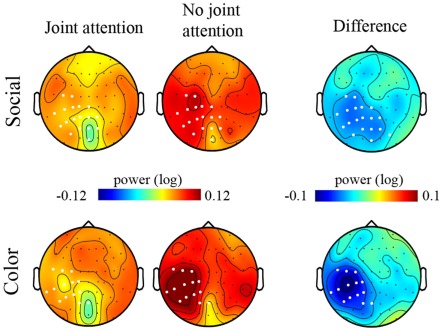
Figure 5.
Maps of the signal power in the 11–13 Hz frequency band under each experimental condition. Maps (top views of the head) of the grand mean of the signal power between 11 and 13 Hz are represented under the Joint attention (left column) and the No-joint attention (middle column) conditions for the Social (upper row) and the Color (lower row) instructions. The difference maps corresponding to the grand mean difference in 11–13 Hz signal power for the Joint versus the No-joint attention conditions, under the Social and the Color instruction respectively, are represented in the rightmost column. The white dots on the maps represent the electrodes on which the t-tests revealed a significant difference between Joint and No-joint attention conditions (p < 0.01) for the socially driven and color-driven instructions respectively.

