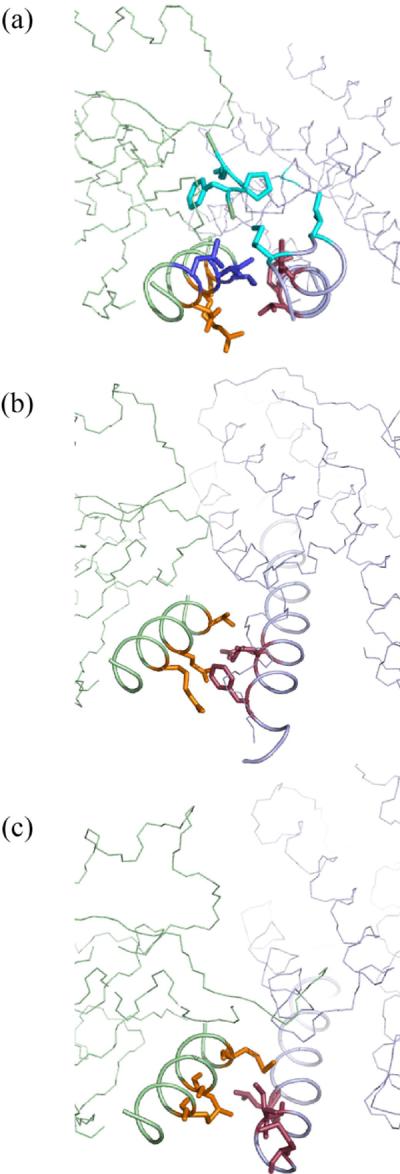
Figure 10.

(a) (b) (c). Comparison of HPt-RR interaction surface in the E. coli P1-CheY complex (a), the yeast Ypd1-Sln1(R1) complex (b), and the R. sphaeroides CheA3P1-CheY6 complex (c). HPt domains are shown on the right in light blue, and RRs are shown on the left in light green. The residues responsible for the HPt interaction in yeast Sln1(R1) and R. sphaeroides CheY are colored orange. The interacting residues in yeast Ypd1 and R. sphaeroides CheA3P1 are shown in dark red. The equivalent positions in the E. coli proteins are shown in the same colors. E. coli CheY observed to be interacting with P1 are shown in blue. An additional interaction between CheY loop (109–111) and P1 M3 and I5 are shown in cyan.
