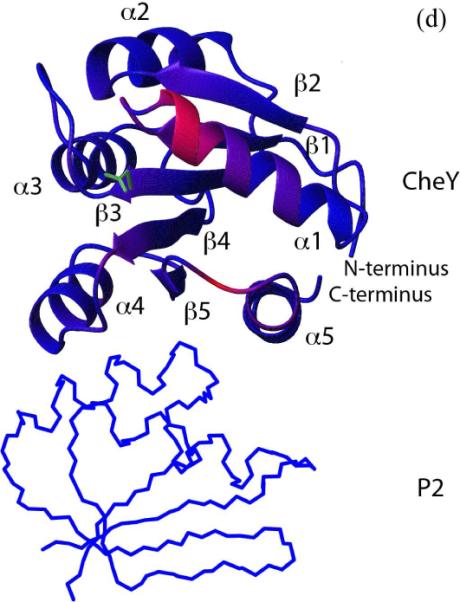
Figure 3.

(d). The chemical shift perturbation of CheY complexed with P2 (PDB code 1EAY) in the presence of P1 shown in (c) was color-coded and plotted onto the CheY structure. The red color indicates larger chemical shift difference. Residues in blue color showed smaller differences. The active site aspartate and its side chain are shown in green.
