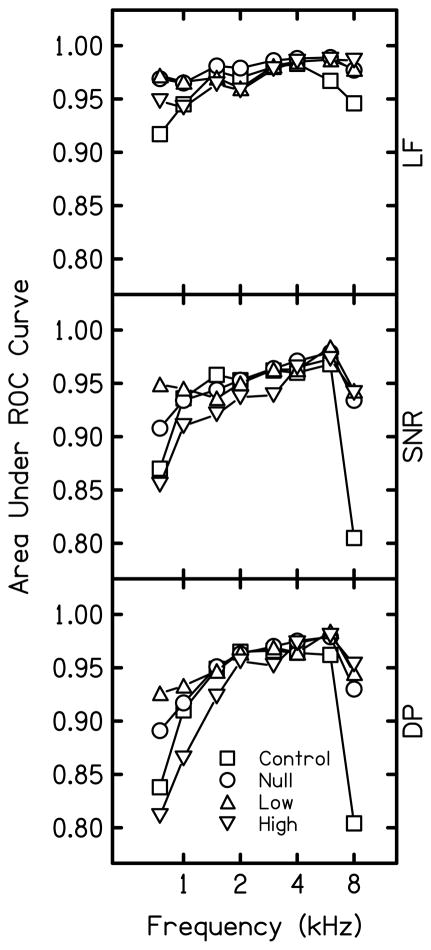
Figure 1.
AROC for control and experimental conditions. The upper panel shows AROC using multivariate logistic regression analysis (LF), the middle panel shows AROC using univariate analysis of SNR at 2f1-f2 (SNR), and the bottom panel shows AROC using univariate analysis of distortion product level at 2f1-f2 (DP). Squares represent results for the control condition, circles represent the null-suppressor condition, upright triangles represent the low-suppressor condition, and inverted triangles represent the high-suppressor condition.

