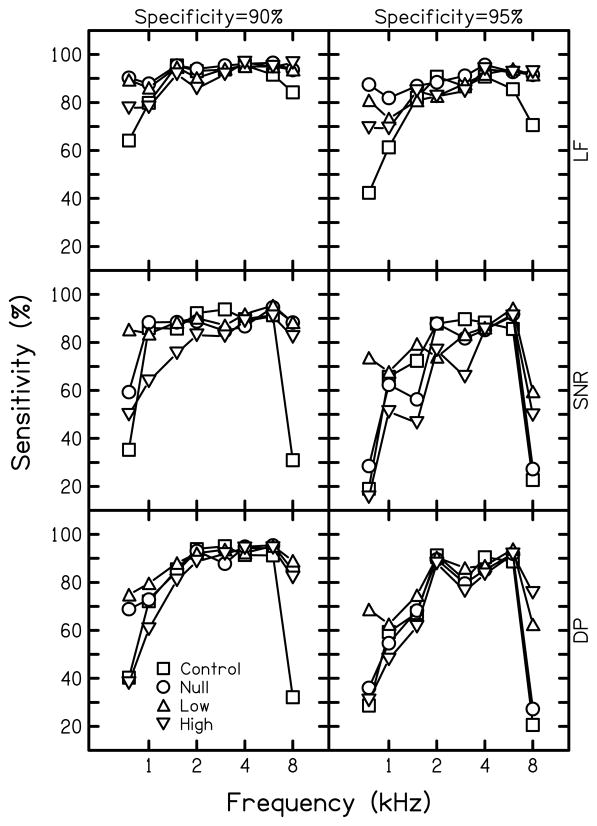
Figure 3.
Sensitivity at fixed specificities of 90% and 95% for each condition. Results using multivariate logistic regression analysis (LF) are shown in the top row, followed by univariate analysis of SNR at 2f1-f2 (SNR) and univariate analysis of distortion product level at 2f1-f2 (DP) methods, in descending order. Squares represent sensitivity for the control condition, circles represent the null-suppressor condition, upright triangles represent the low-suppressor condition, and inverted triangles represent the high-suppressor condition.

