
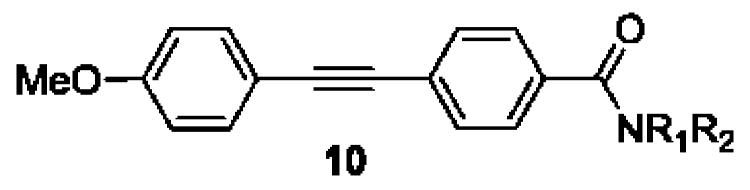
Table 1.
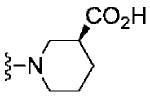
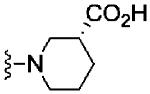
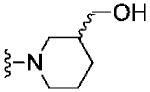
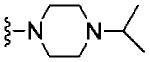
Structures and Activities of Analogs 10.
| ||||
|---|---|---|---|---|
|
| ||||
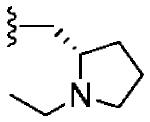
| Cmpd | NR1R2 | plC50a ±SEM |
IC50 (μM)a | %Glu Minb ±SEM |
| 7 |
|
5.42±0.04 | 3.8 | 10.4±2.1 |
| 10a |
|
5.30±0.06 | 5.0 | 4.4±0.7 |
| 10b |
|
5.61±0.07 | 2.5 | −1.1±0.5 |
| 10c |
|
5.24±0.01 | 5.7 | 2.2±1.1 |
| 10d |
|
>10 | 16.4±2.5 | |
| 10e |
|
5.69±0.04 | 2.1 | 0.5±0.4 |
| 10f |
|
>10 | 7.6±3.2 | |
| 10g |
|
>10 | 9.6±2.1 | |
a
Measured in an mGlu3 GIRK assay.
b
% Glu Min is the % inhibition of the compound on an EC80 concentration of glutamate. Values represent the mean ± standard error mean for three independent experiments performed in triplicate.