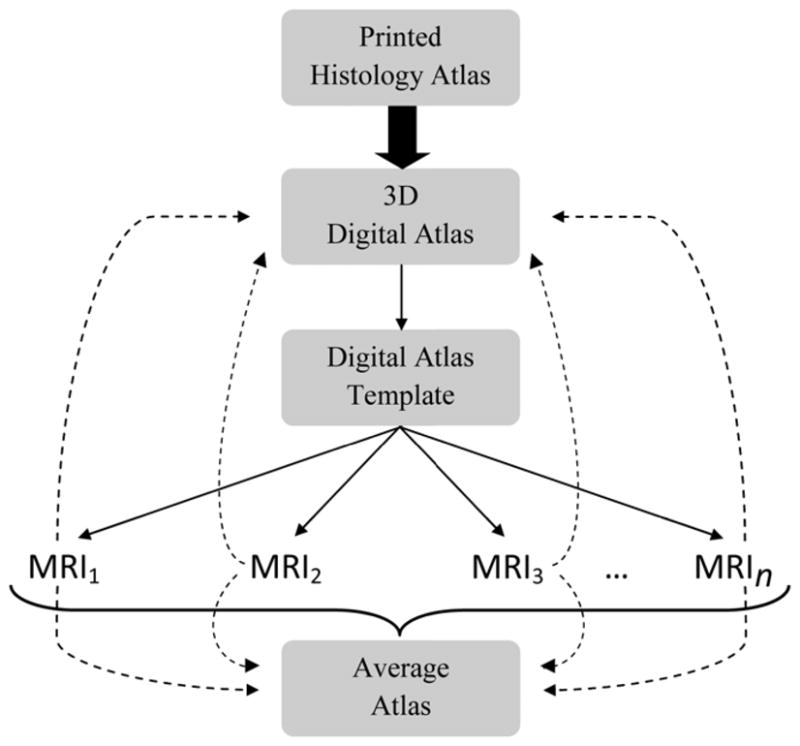
Figure 1.

Schematic representation of the processes involved in triangular mesh generation from the original histology atlas, adaptation to individual mouse MRI, creation of an average atlas (based on a single age cohort) and comparison of individual MRI to both original histology structures and new average atlas structures. The printed histology atlas was converted to a three-dimensional, digital atlas using mesh generation tools in Pinnacle3 (thick arrow). A template digital atlas (adapted to a randomly selected mouse’s MRI volume using the methods described above) was then registered and adapted to individual mouse MRI volumes in an age cohort (represented as MRI1, MRI2, etc; adaptation represented by thin solid arrows). Structures from the digital atlas adapted to individual mouse MRI were then combined into an average atlas (bracket), which was then compared to both individual mouse structures and to the original histology atlas (dashed arrows).
