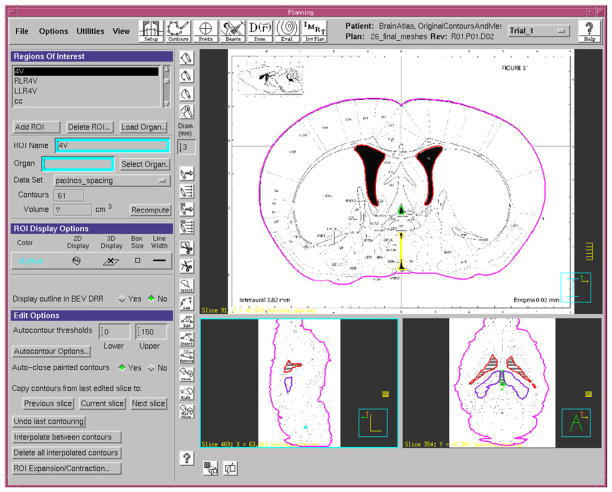
Figure 2.
The Pinnacle3 radiation therapy planning software interface during mesh generation. The right side of the interface screen shows orthogonal views of the digital versions of slices of Paxinos and Franklin’s mouse brain atlas (Paxinos and Franklin 2001). Regions of interest (ROIs) corresponding to the outer surface of the brain (magenta), lateral ventricles (red), dorsal third ventricle (green), third ventricle (yellow), fourth ventricle (blue) and hippocampus (purple) are displayed.

