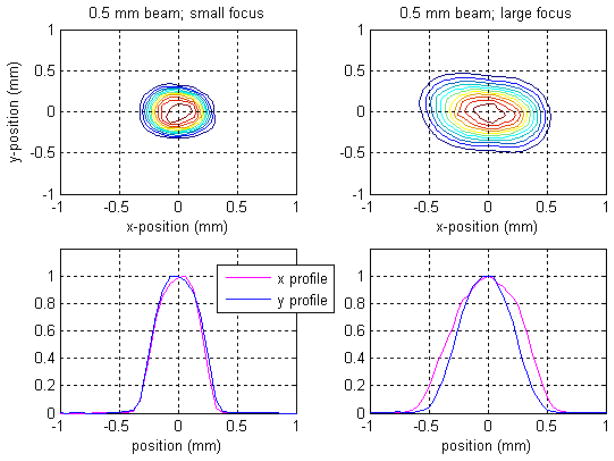
Figure 12.
Dependence of the SARRP 0.5 mm circular beam on the focal-spot size. The left panels show a 2D contour dose plot and individual x, y dose profiles for the smallest SARRP beam resulting from the small focal-spot size (0.4 mm). The beam is reasonably symmetric. The right panels are the corresponding results for the large focal spot (3 mm). The beam in this case is considerably broader and asymmetric, with a slight rotation evident in the 2D distribution.

