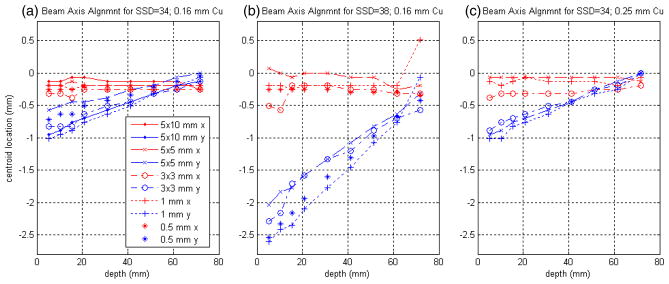
Figure 6.
Correspondence of the SARRP commissioning jig z-axis with the physical beam axis, as indicated by the location of the measured beam spot on the registered films as a function of depth. Red and blue data points correspond to the observed beam-spot centroids in x and y, respectively. The film set exposures for (a) and (c) were measured one after the other, whereas (b), for SSD = 38 cm, was measured last and required a change in the configuration of spacers to change the SSD. (See text for further description).

