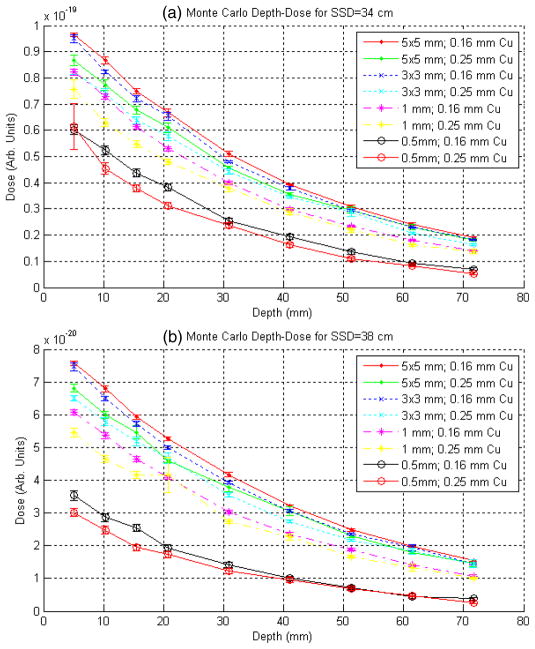
Figure 7.
Raw depth–dose curves in water from the Monte Carlo calculations for the full set of simulated geometries using the CHAMBER CM description of the measurement phantom. Plotted in (a) and (b), respectively, are the results for SSD = 34 and 38 cm. All simulations were seeded with the same primary PSF at the exit of the x-ray tube, thus the relative relationship between the curves is meaningful. The statistical error bars included here were computed by BEAM. (See the text for further description.)

