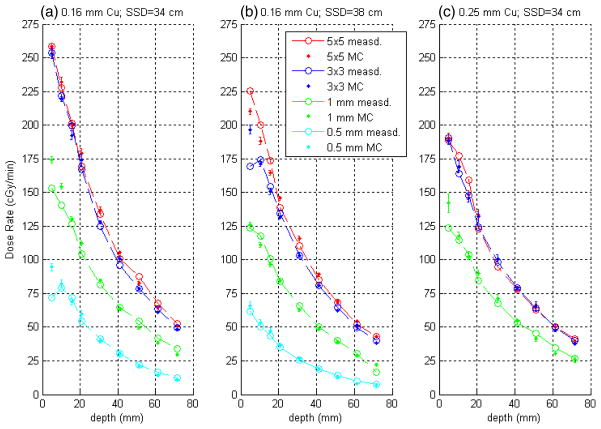
Figure 8.
Comparison of measured and computed depth–dose curves for the SARRP. Plotted are (a) SSD = 34 with 0.16 mm Cu; (b) SSD = 38 with 0.16 mm Cu; (c) SSD = 34 with 0.25 mm Cu filtration. Measured data are plotted as open circles with Monte Carlo data plotted as points with statistical error bars computed by BEAM. Computed data have been normalized to measurement to best-fit over the range of depths.

