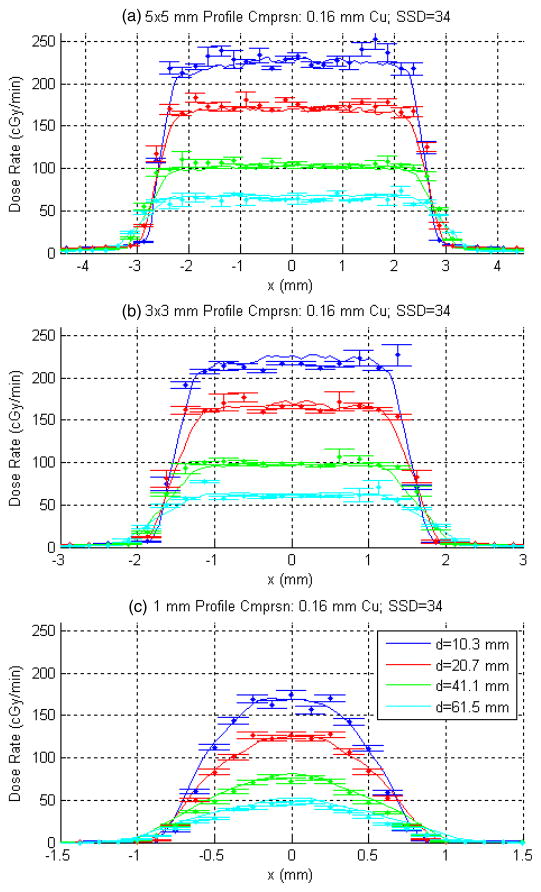
Figure 9.
A sampling of measured (solid lines) versus computed x-profiles (points) for SSD = 34 cm and 0.16 mm Cu filtration for (a) 5 × 5 mm2, (b) 3 × 3 mm2 and (c) 1 mm collimators. Four of nine measured depths, chosen arbitrarily, are shown. DOSXYZ was used to generate the computed profiles, with statistical error bars shown. For a given aperture size, the computed results were normalized to measurement in the high-dose regions, giving equal weights to all depths (including those not shown) and applying a single scaling factor.

