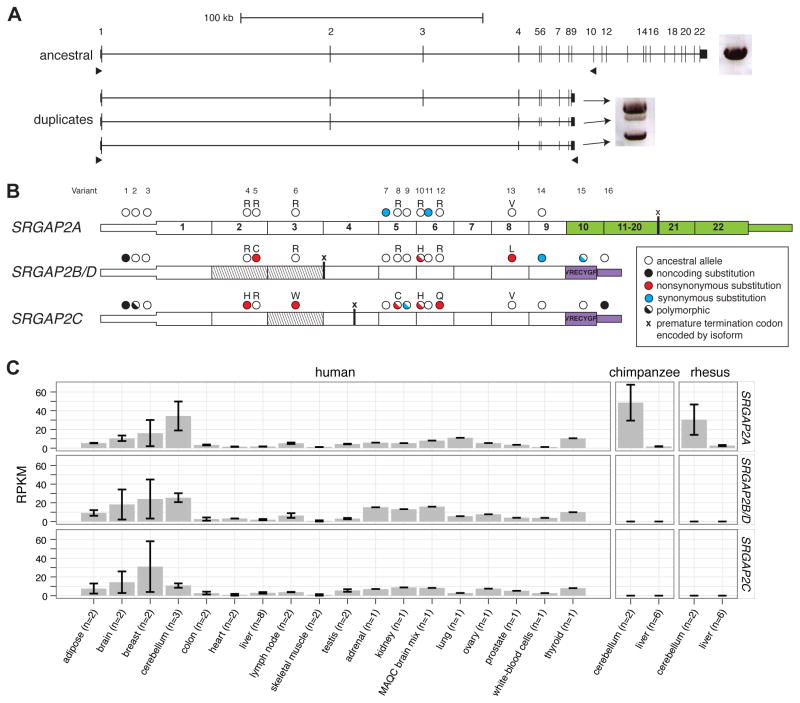
Figure 3. Paralog-specific SRGAP2 gene expression.
(A) Long-range RT-PCR products from pooled fetal brain RNA are shown next to the gene models. A single band was amplified from the ancestral paralog, while three bands were amplified from duplicate paralogs using primers designed to target alternative isoforms. 96 cDNA transcripts were cloned and sequenced. (B) Fixed paralog-specific variants were used to assign transcripts to respective genomic loci allowing both polymorphic and fixed putative amino acid changes to be deduced. Exonic sequence specific to the ancestral copy (SRGAP2A; green) and the duplicate loci (SRGAP2B/C/D; purple) are shown. The locations of stop codons encoded by isoforms missing exons are represented with an “x”. Exons missing from transcripts are indicated (diagonal lines) and likely correspond to the genomic deletion within SRGAP2D in the case of the exon 2–3 deleted isoform. (C) Paralog-specific expression profiling was performed using RNA-Seq data mapped to unique sequence identifiers. The specificity of next-generation sequence data and the determination of fixed single base-pair difference between the copies was necessary to tease apart the expression profiles of these virtually identical copies. Chimpanzee and macaque RNA-Seq data affirm the specificity of this assay. Also see Figure S3 and Table S3 for additional expression results.

