
Figure 6.
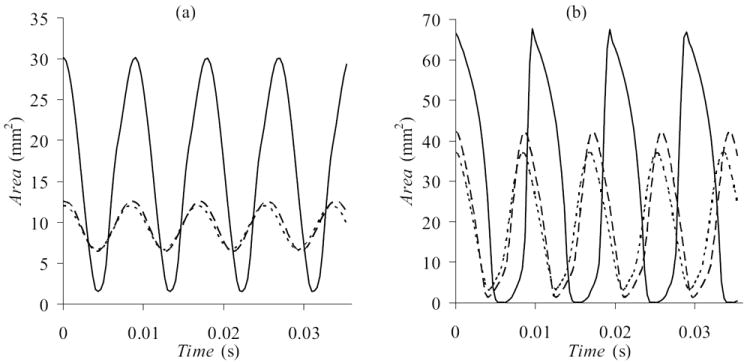
Glottal area derived from VKG images for (a) low (1.0 kPa) pressure and (b) high (2.0 kPa) pressure. Vertical scales are adjusted. Data for asymmetric (-- L24R22, – – L24R23) and symmetric (— L24R24) models are compared.
Official websites use .gov
A
.gov website belongs to an official
government organization in the United States.
Secure .gov websites use HTTPS
A lock (
) or https:// means you've safely
connected to the .gov website. Share sensitive
information only on official, secure websites.
Glottal area derived from VKG images for (a) low (1.0 kPa) pressure and (b) high (2.0 kPa) pressure. Vertical scales are adjusted. Data for asymmetric (-- L24R22, – – L24R23) and symmetric (— L24R24) models are compared.