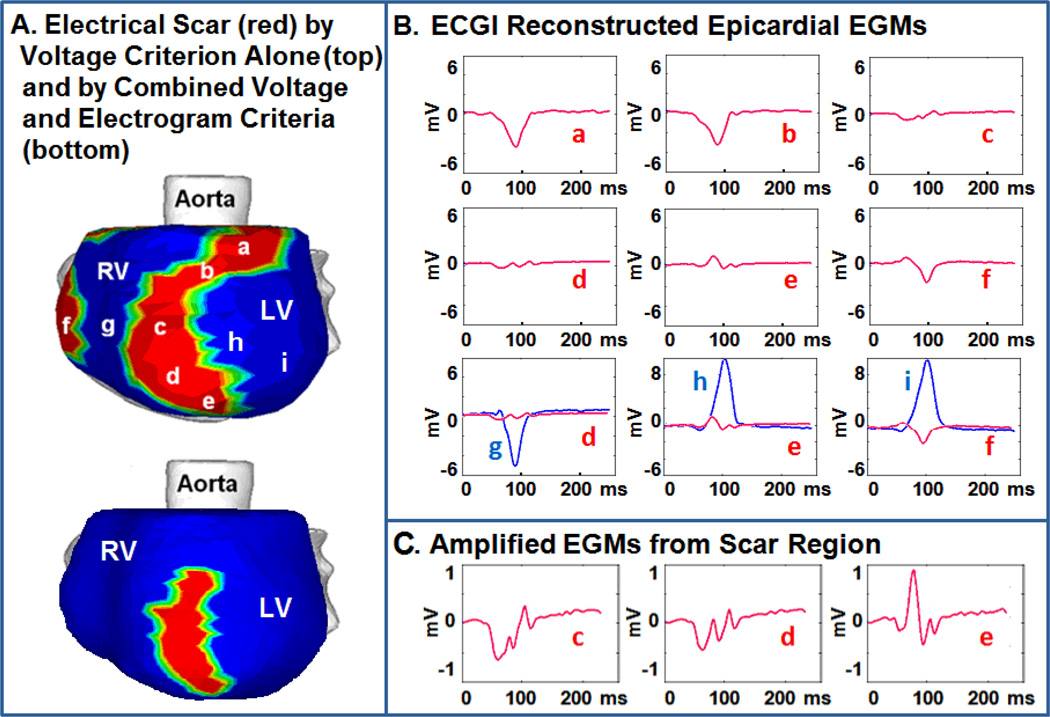
Figure 2.
EGM Characteristics A: Electrical scar (red) is shown in the left anterior obligue view. Top image uses a reduced voltage criterion to identify scar. Bottom image uses reduced voltage and EGM fractionation to identify scar. B: EGMs a,b and f (red) from low voltage regions demonstrate low amplitude alone. EGMs c–e (red) demonstrate both fractionation and low amplitude. EGMs g–i (blue) from neighboring regions outside the scar demonstrate considerably larger amplitude and single deflection. C: EGMs c–e amplified to clearly demonstrate multiple deflections.

