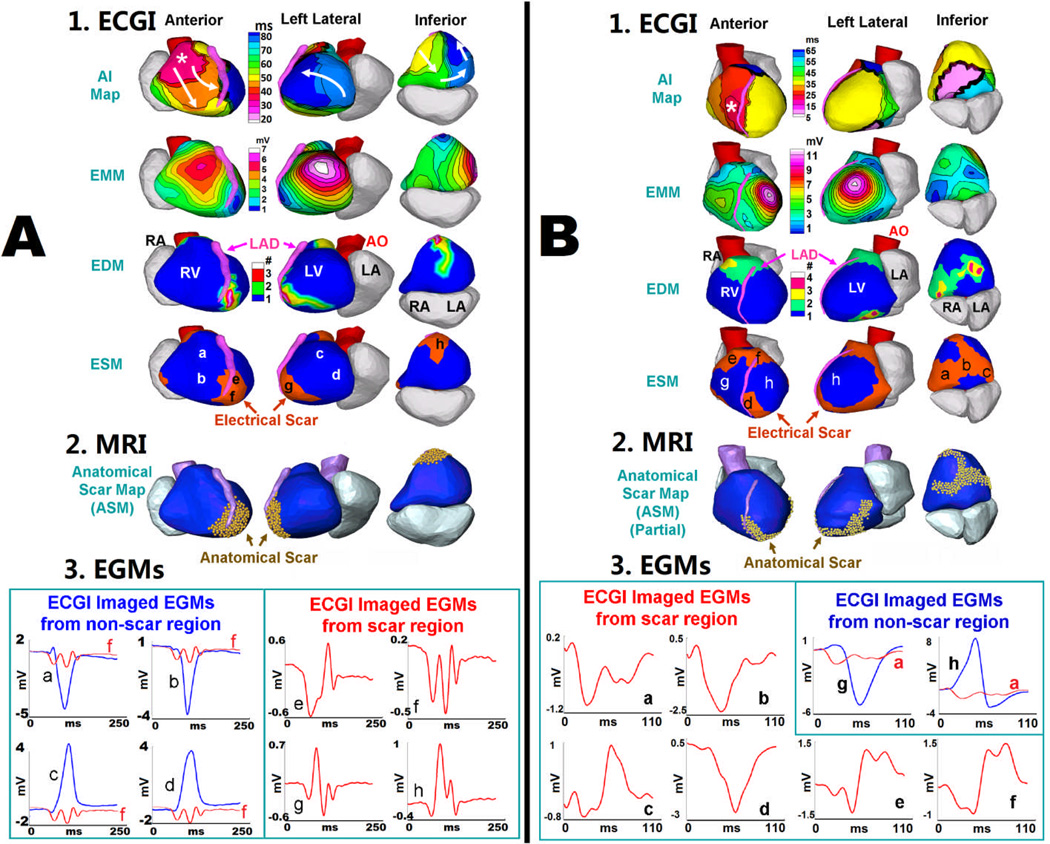
Figure 3.
Relationship between ECGI-derived Electrical Scar and DE-MRI Anatomic Scar. A: Apical MI. 1, top to bottom: SR activation map (AI map), EMM, EDM and ESM (three views). Asterisk in AI map marks the RV breakthrough site of earliest activation; arrows show wavefront propagation. Latest activation is in LV apex (dark blue) which is abnormal. ESM demonstrates an electrical scar at apex (red). 2: Anatomical scar map from DE-MRI (gold) shows similar apical distribution of scar. 3: Four selected EGMs from non-scar region (blue) and from scar region (red) (locations indicated on ESM). Scar EGMs are shown together with non-scar EGMs to demonstrate magnitude difference, and on amplified scale to show clearly multiple deflections (fractionation). B: Inferior MI. Similar format to panel A. SR activation of the inferior septum is abnormal (pink region in AI map). ESM demonstrates electrical scar that extends across the inferior wall and toward the apex, similar to the anatomical scar

