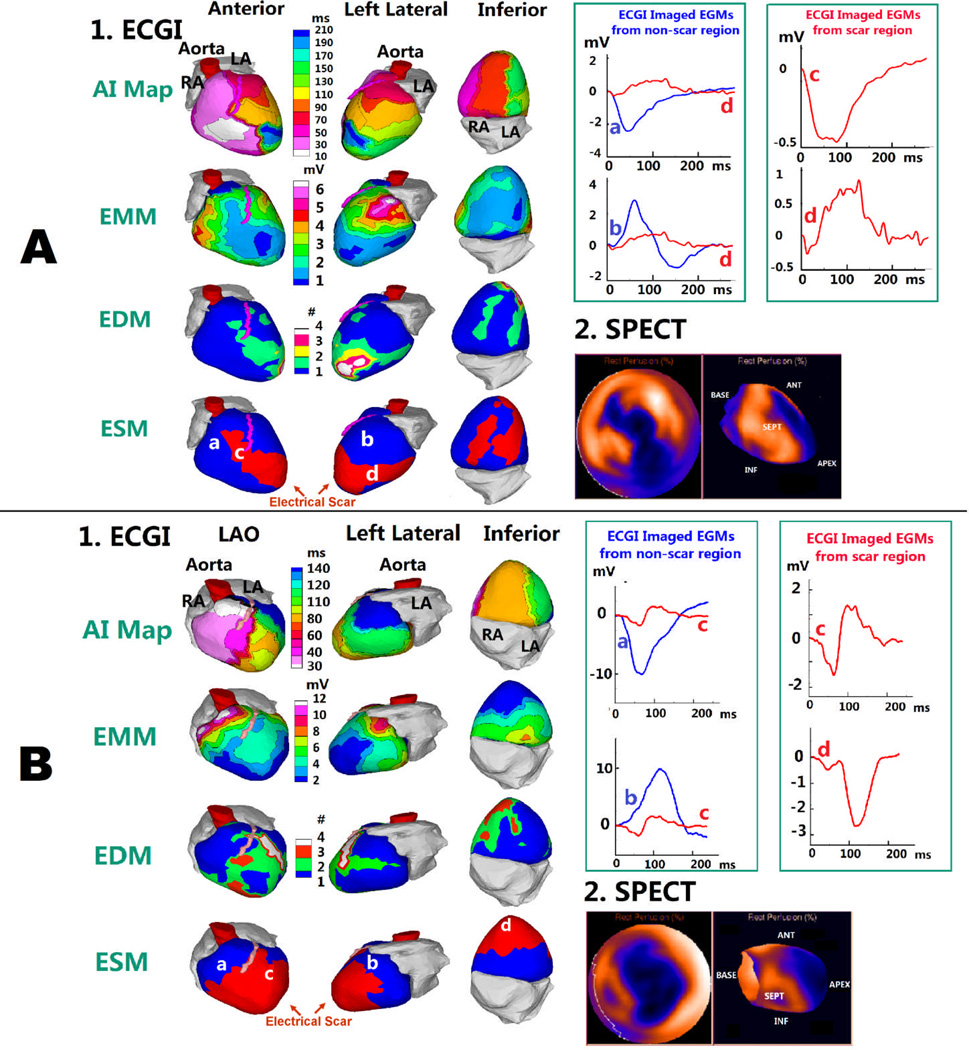
Figure 5.
Relationship between ECGI-derived Electrical Scar and SPECT Anatomic Scar. Similar format to Figure 3, except SPECT images replace MRI scar maps. A: Apical MI. Latest activation is in the anterior apex (dark blue in AI map), which is abnormal. ESM demonstrates an electrical scar in the apex, extending anteriorly and inferiorly (red). Resting myocardial perfusion images (SPECT), shown in a standard “bullseye” configuration (left) and long-axis view (right), demonstrate large area of infarction in the anterior, apical and inferior LV.
B: Apical Aneurysm. ESM demonstrates a large electrical scar across the apex. SPECT imaging shows similar extensive apical distribution of scar.

